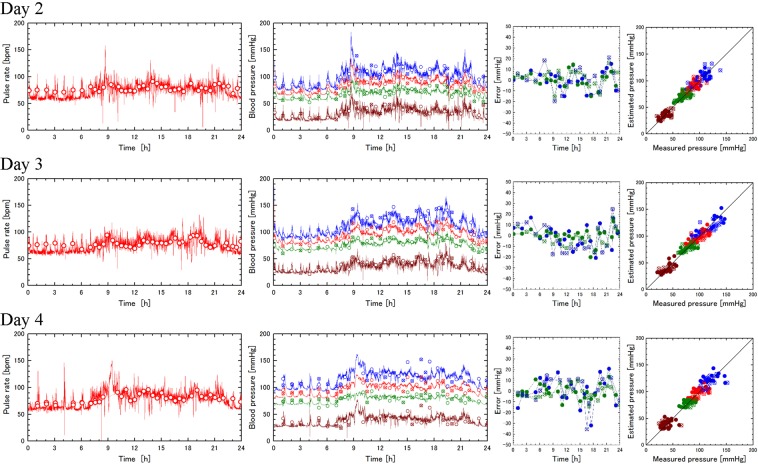
Figure 4.
DCBP estimation for subject 1 in four days. Comparison between days 2–4 for pulse rate measurements (first column) by wearable device (lines) and sphygmomanometer (circles), blood pressure variations (second column) by computations (lines) and sphygmomanometer measurements (circles), errors in calculated systolic and diastolic blood pressures (third column), and correlations between measured and calculated blood pressures (fourth column). Refer to the legend of Fig. 2 for details.

