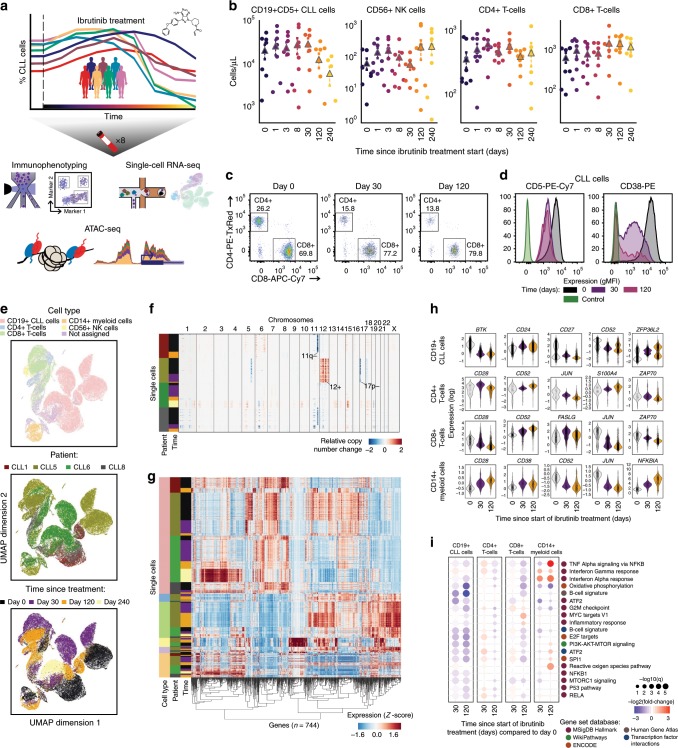
Fig. 1. Multi-omics analysis of ibrutinib time courses reveals broad changes among immune cells.
a Schematic representation of the study design. Peripheral blood from patients with CLL undergoing single-agent ibrutinib therapy was collected at defined time points and assayed by flow cytometry (cell composition and immunophenotype), single-cell RNA-seq (gene expression), and ATAC-seq (chromatin accessibility). b Cell type abundance over the ibrutinib time course, as measured by flow cytometry. Triangles represent the mean for each time point and dashed lines indicate the 75% confidence interval around the mean, calculated across seven patients. c Flow cytometry scatterplots showing the abundance of T cell subsets for one representative patient at three time points (day 0: before the initiation of ibrutinib therapy, day 30 (120): 30 (120) days after the initiation of ibrutinib therapy). Cells positive for CD3 or CD8 were gated as indicated by the black rectangles and quantified as percentages of live PBMCs. d Flow cytometry histograms showing CD5 and CD38 expression on CLL cells (pre-gated for live, single CD19+CD5+ cells) for a representative patient and three time points. e Two-dimensional similarity map (UMAP projection) showing all 43,049 single-cell transcriptome profiles that passed quality control. Cells are color-coded according to their assigned cell types based on the expression of known marker genes. f DNA copy number profiles for CLL cells, as inferred from single-cell RNA-seq data. Three genetic aberrations common in CLL are indicated. For illustration, 2500 randomly selected CLL cells are shown for each patient. g Clustered single-cell transcriptome heatmap for the most differentially expressed genes between time points. For illustration, 20,000 randomly selected from a total of 43,049 cells are displayed. h Violin plots showing the distribution of gene expression levels for selected differentially expressed genes over the time course. i Differential gene expression signatures in four cell types, comparing each sample to the matched pre-treatment sample and averaging across patients. e–g, i Based on scRNA-seq data for 12 samples obtained from four patients.

