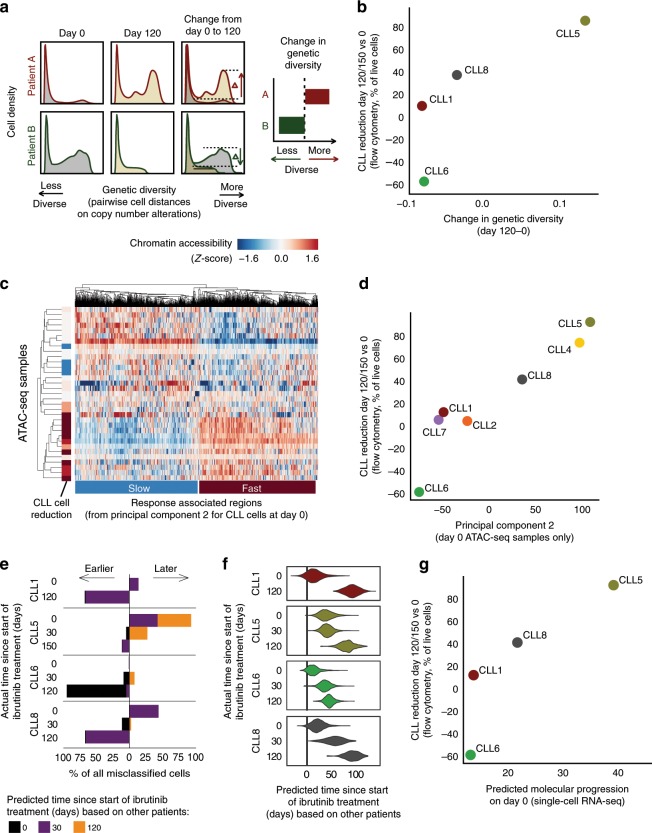
Fig. 4. Heterogeneity across patients reflects and predicts the patient-specific temporal response to ibrutinib.
a Computational approach to quantify changes in genetic diversity based on copy number profiles inferred from the single-cell RNA-seq data. Shifts in the distribution of pairwise distance similarities between time points indicate changes in the genetic diversity of the cell population. b Scatterplot comparing across patients the change in genetic diversity between day 0 and day 120/150 of ibrutinib treatment (x-axis) with the change in the CLL cell percentage on day 120/150 of ibrutinib treatment compared to day 0 as measured by flow cytometry (y-axis). c Clustered heatmap for chromatin accessibility profiles of CLL cells, based on ATAC-seq data for 33 samples obtained from seven patients. The heatmap shows the top 1000 genomic regions that at day 0 associate with the second principal component (Supplementary Fig. 11a), annotated on the left with the change in CLL cell fraction (as in b). d Scatterplot comparing across patients the average chromatin accessibility for regions linked to the second principal component (as in c, x-axis) with the change in CLL cell fraction (as in b, y-axis). e Stacked bar charts showing the number and direction of deviations from the actual collection time point when predicting time points in each patient after training the classifier in all other patients. f Violin plots showing the predicted (x-axis) and actual (y-axis) number of days under ibrutinib therapy in each patient. Predictions are derived from regression models trained on all other patients. g Scatterplot comparing the predicted time under ibrutinib therapy (from f, x-axis) with the change in CLL cell fraction (as in b, y-axis).

