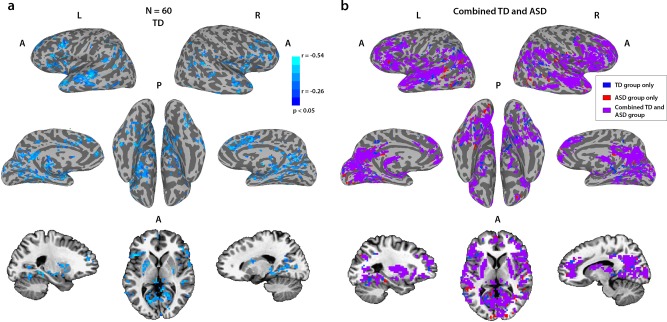
Fig. 4. Correlations between neural typicality and eye movement typicality.
a Correlations between eye movement typicality and neural typicality for the full TD group at a corrected threshold of p < 0.05, corrected through cluster size permutation testing. b All voxels whose neural typicality was significantly correlated with eye movement typicality, for the combined group of the ASD participants and their matched controls (purple, N = 69), with voxels that were only correlated for the corresponding analysis of the matched TD group (N = 36) in blue and voxels that were only correlated for the corresponding analysis of the ASD group (N = 33) in red. It is noteworthy that the combined analysis is more widespread than either analysis separately.

