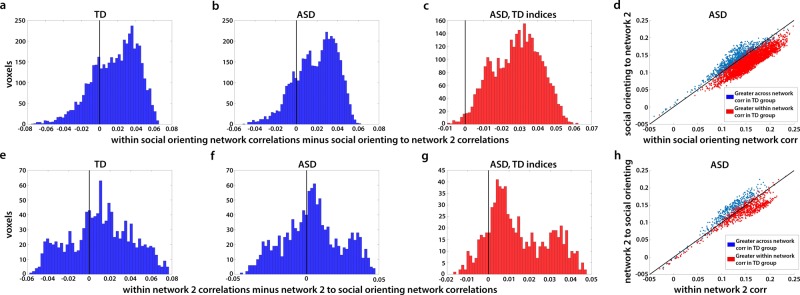
Fig. 6. Distribution of within vs. across-network correlations for all non-overlapping voxels identified in the analyses portrayed in Fig. 4 (social orienting network) and Fig. 5 (network 2).
a Histograms shows the average correlation of each voxel in the social orienting network to all other voxels in the social orienting network, minus its average correlation to all voxels in network 2, averaged across all matched TD participants. Vertical black line at 0 denotes equal correlation, i.e., voxels are equally correlated to the other voxels within network as to voxels across network. Voxels to the left are more correlated across networks than within network (i.e., higher correlation to voxels in network 2), and voxels to the right are more correlated within network than across networks. b Same for the ASD group. Note the significant rightward shift in both these plots (p = 5.4 × 10¹²). c Distribution in the ASD group of all the voxels in the social orienting network, which were more correlated within the social orienting network than to the voxels in network 2 in the TD group, using the TD indices for these voxels. Ninety-nine percent of voxels with greater within vs. across-network correlations in the TD group were also more correlated within network in the ASD group. d Scatter plot of the same analysis shown in b and c. Each dot represents one voxel in the social orienting network; value on the x axis reflects average correlation to all other voxels in the social orienting network and value on the y axis reflects average correlation to all voxels in network 2, averaged across all ASD participants. Identity line (i.e., equal correlation to both networks) marked in black. Blue dots are voxels that were less correlated within than across network in the matched TD group, whereas red dots are voxels which had greater within than across-network correlations in the matched TD group. Note the almost complete correspondence across the two populations. Panels e–h show the same analyses as above, for correlations of voxels in network 2 to all other voxels in network 2 vs. their correlations to voxels in the social orienting network.

