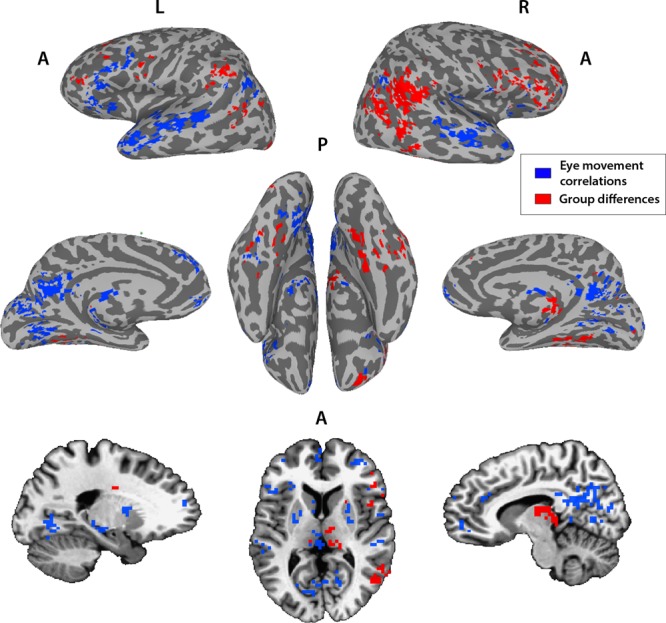
Fig. 7. Two distinct networks derived from neural typicality group differences and eye movement correlations.

Overlay of the subset of voxels with significant correlations between neural typicality and eye movement typicality of the combined matched TD and ASD groups (N = 36 TD + 33 ASD, blue) and voxels showing significant group differences in neural typicality between the matched TD and ASD groups (N1 = 36 TD, N2 = 36 ASD, red), which also show greater within than across-network connectivity. Threshold set at p < 0.01.
