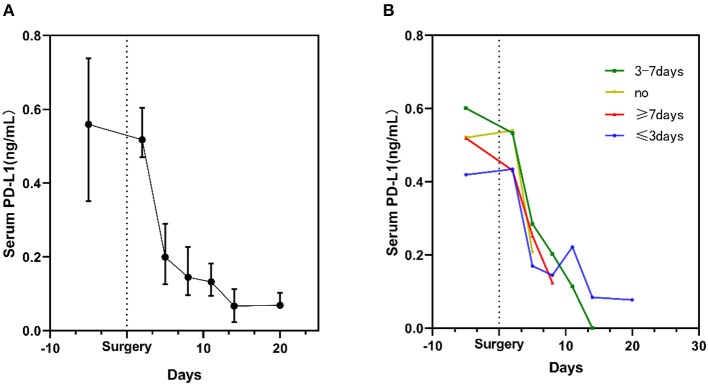
Figure 2.
Kinetic changes in serum sPD-L1 levels in glioma patients during the perioperative period. (A) Kinetic changes in all glioma patients. Dots display the medians, and whiskers represent the interquartile ranges. (B) Serum sPD-L1 levels in patients stratified by the time of exposure to steroids. The plots display the medians.

