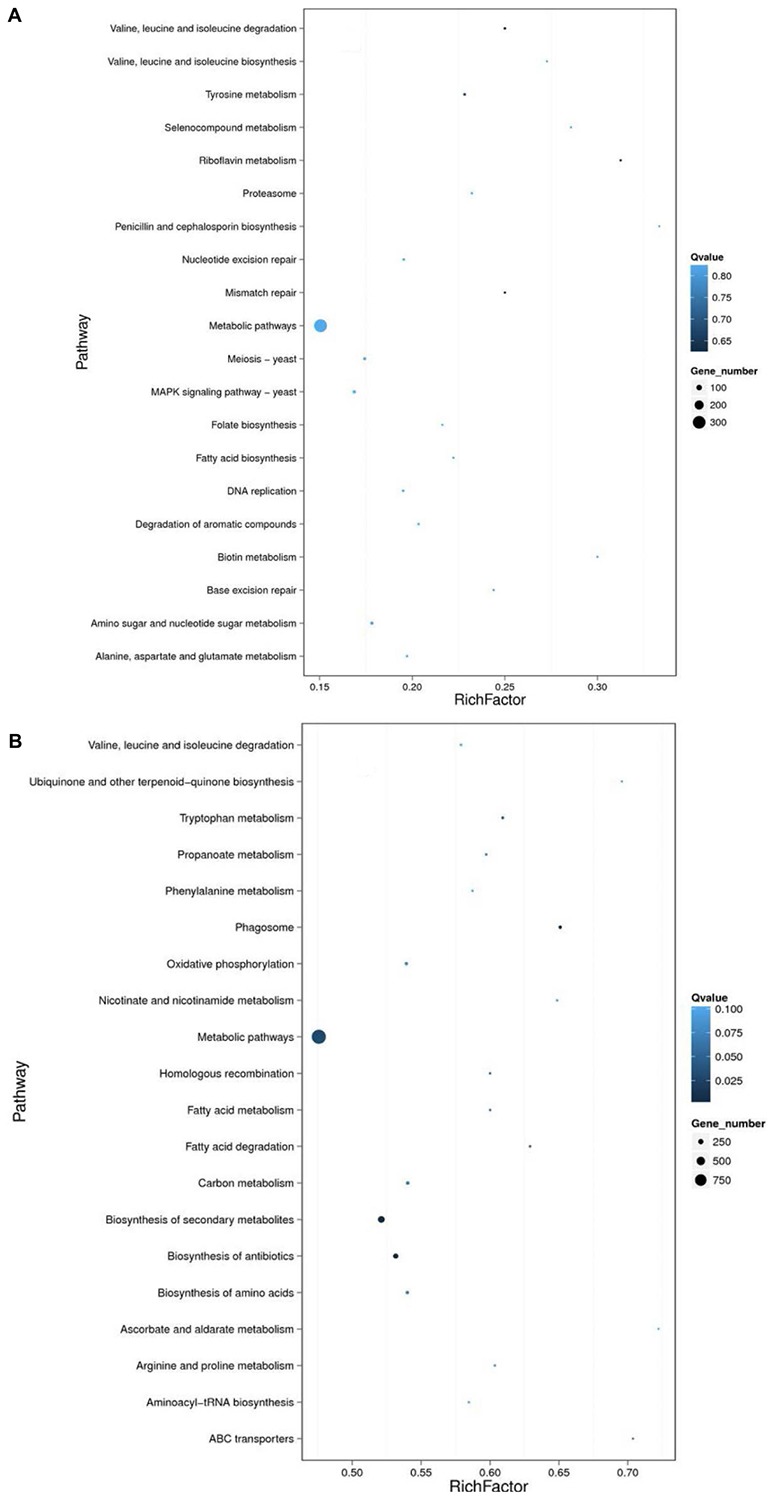
FIGURE 3.

KEGG pathway enrichment analysis. The DEGs in comparison groups AO-Re/AO-So (A) and AO-G24/AO-Ck (B) were analyzed through KEGG pathway enrichment analysis. AO-Ck, fresh conidia; AO-G24, germinated conidia; AO-So, fungistatic conidia; AO-Re, glucose-relieved conidia.
