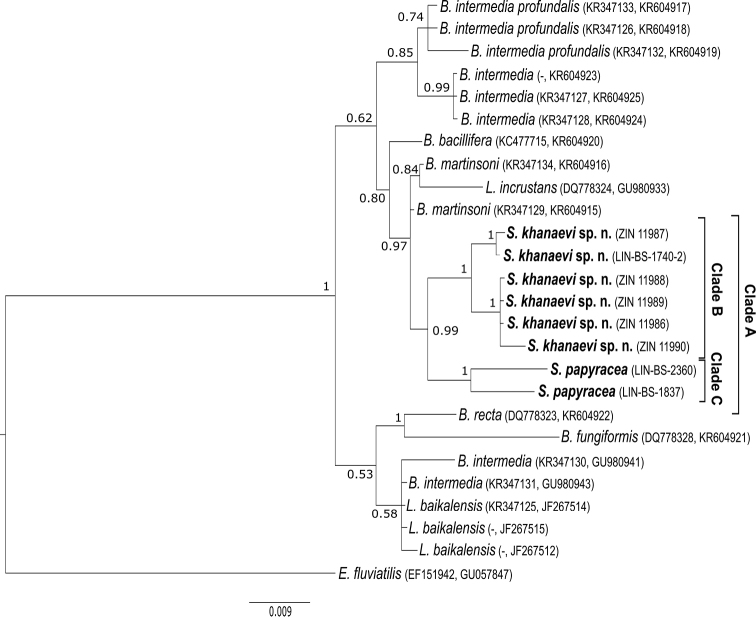
Figure 2.
Phylogenetic tree based on concatenated nuclear (ITS1 and ITS2) and mitochondrial (IGRs) sequences: Bayesian posterior probabilities are shown at the bases of the clusters. Taxon names and collection numbers of sponges analysed in this study are marked in bold. Scale bar denotes substitutions per site.

