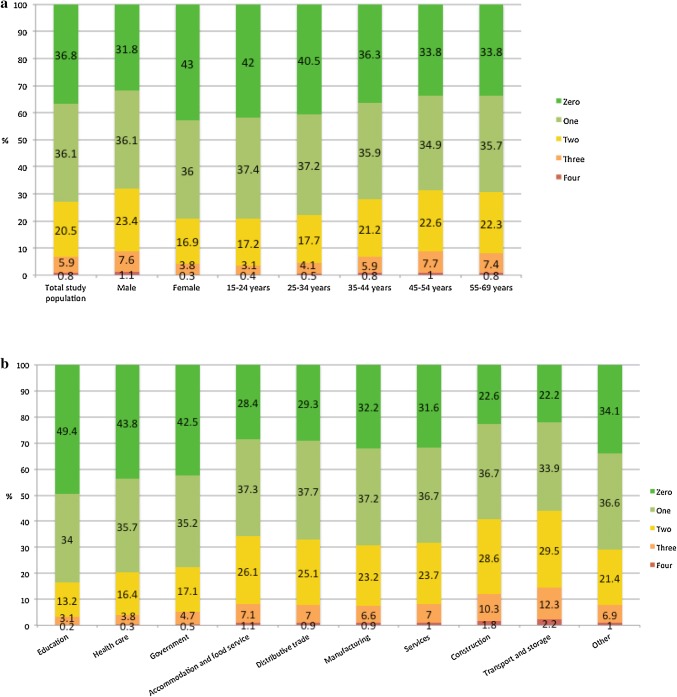
Fig. 1.
a Distribution of workers by number of poor health metrics in the total study population and by gender and age category. Chi-square with Bonferroni correction, testing the relationship between number of poor health metrics and gender: p < 0.001. Chi-square with Bonferroni correction, testing the relationship between number of poor health metrics and age category: p < 0.001. b Distribution of workers by number of poor health metrics by economic sector. Chi-square with Bonferroni correction, testing the relationship between number of poor health metrics and sector: p < 0.001

