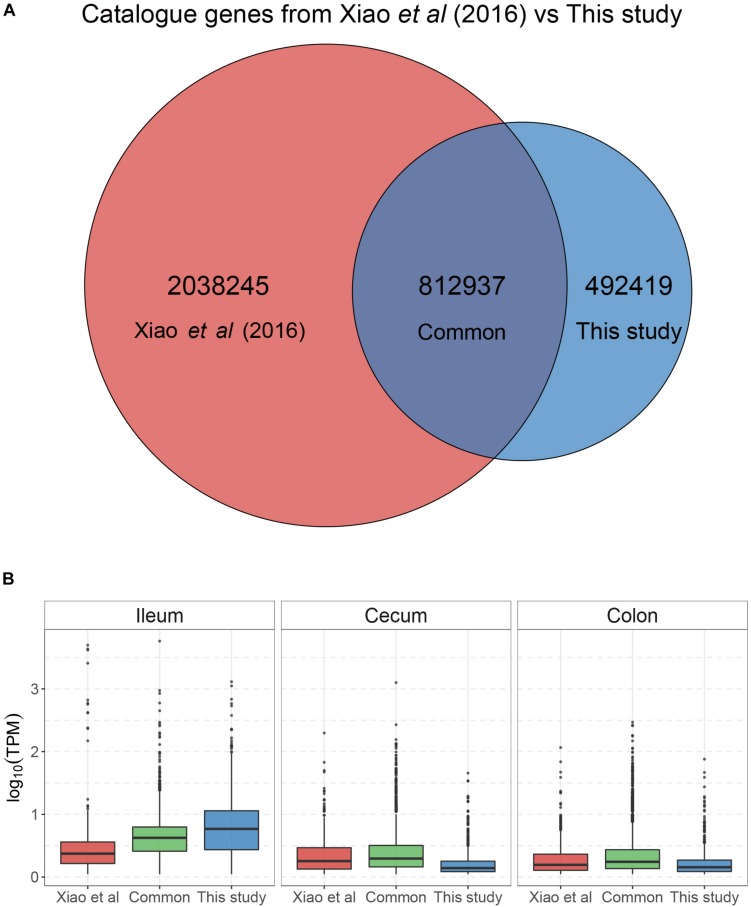
FIGURE 2.
Distribution of abundance of genes in the gene catalog. The gene catalog was constructed by merging genes identified in the present study and a previous reference set (Xiao et al., 2016). (A) Venn diagram of intersection between the genes in the reference set and identified in the present study. (B) Boxplot showing the distribution of gene abundance in each category based on the Venn diagram.

