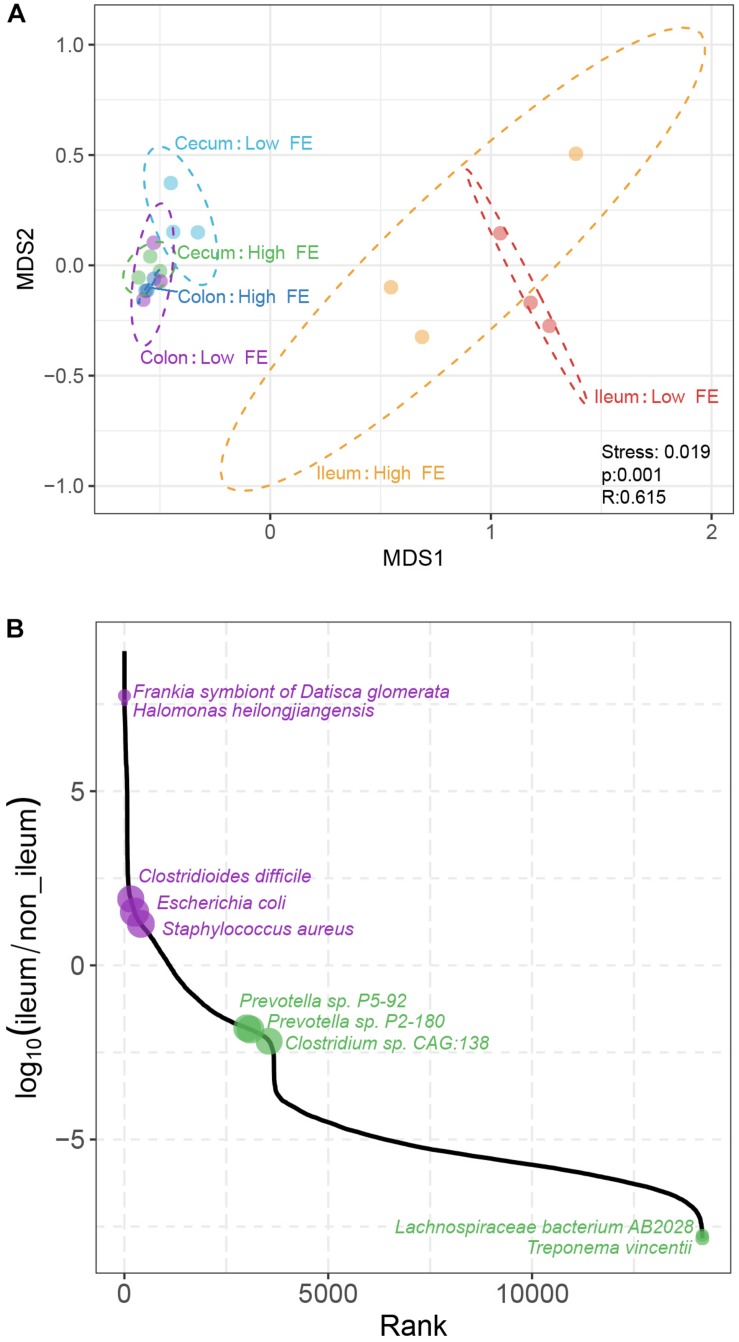
FIGURE 4.
Comparison of microbial composition based on species abundance among samples. (A) Non-metric multidimensional scaling (NMDS) plot according to FE performance and intestinal location based on the abundance of species. The plot is based on the Bray–Curtis distances between pairs of samples. Each point represents one sample; ellipses represent the 95% confidence for all points within each cluster. Stress, the value used to estimate the NMDS ordination fitness. R, the statistic from the analysis of similarities (ANOSIM) that compares the mean of ranked dissimilarities between groups to the mean of ranked dissimilarities within groups. p, the p-value from ANOSIM analysis between groups. (B) The abundance ratio of different species between the ileum microbiota and hindgut microbiota. The species are ordered along the X-axis according to their rank of abundance ratio between the ileum and non-ileum.

