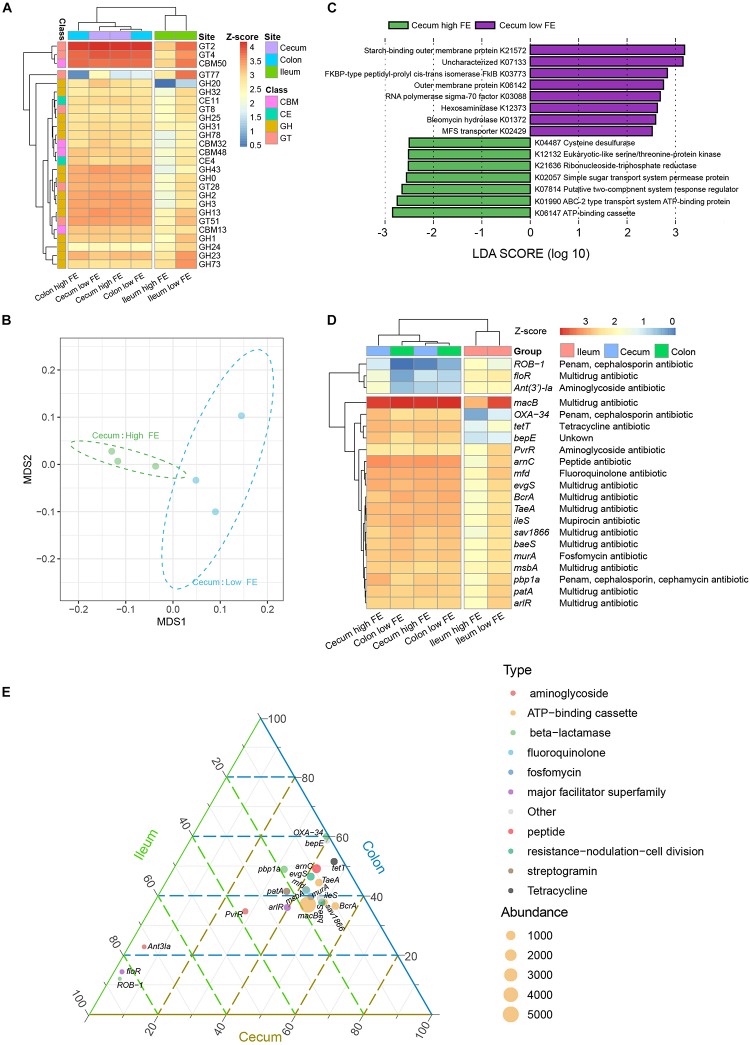
FIGURE 6.
Functional annotation of the microbiomes. (A) Heatmap of the 10 most abundant (based on TPM value) carbohydrate active enzyme (CAZy) families in any of the groups. Color scale shows the abundance of CAZy enzyme family within each group. Z-score, calculated with the formula z = (x − μ)/σ, where x is the log10 of abundance of enzymic families in each group, μ is the mean value of the log10 of abundance in all groups, and σ is the standard deviation of the log10 of abundance. (B) NMDS plot of high and low FE of cecum samples based on the abundance of CAZy families. (C) LEfSE analysis for KEGG orthology (KO) to compare the cecum microbiota functional profiles between the high and low FE group. (D) Heatmap of the 10 most abundant (based on TPM value) antibiotic resistance genes (ARGs) in any of the groups. (E) Ternary plot showing the abundance comparison of the 10 most abundant ARGs of each group in the ileum (green), cecum (brown), and colon (blue). The sum of the abundance for one specific ARG in these three types of gut was set as 100%. The percentage (%) of one specific ARG in each gut location is equal to its corresponding abundance divided by the abundance sum of this ARG in the three intestinal locations. The symbol size indicate the total abundance of the ARGs. The symbol color indicated the types of the ARGs.

