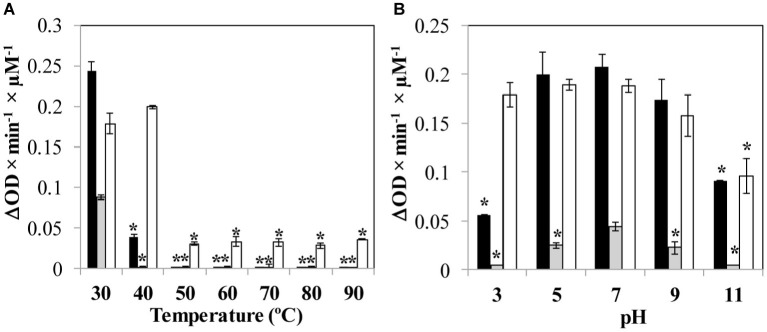
Figure 1.
Influence of environmental parameters (A) temperature and (B) pH on protein activity. Specific lytic activity of the proteins is calculated against S. aureus Sa9. Bars represent the activity (ΔDO600 × min−1 × μM−1) of each protein (LysRODI, black; LysA72, gray and CHAPSH3b white). Data are the mean ± standard deviation of three biological replicates. Asterisks indicate statistical differences (p < 0.05; Student’s t-test) between the specific lytic activity when the protein is submitted to the temperature or pH treatment with the activity observed when the protein is tested at 37°C in NaPi buffer, pH = 7.4. The data were expressed as the mean ± standard deviation of three biological replicates.

