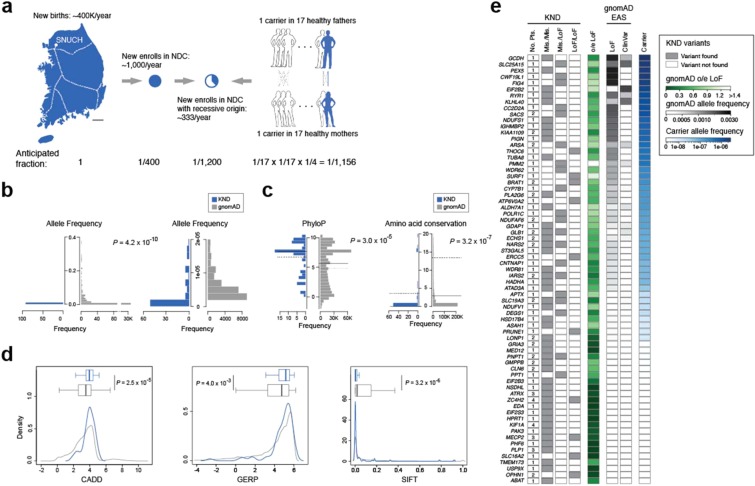
Figure 3.
Screen for rare severe neurodevelopmental disorder carriers. (a) A schematic diagram describing processes used to estimate neurodevelopmental disorder carrier frequency in the Korean population. The dotted lines in the map denote the Korea Train Express network, the high-speed railway system of Korea. (b–d) Distribution differences of various parameters between pathogenic recessive variants from KND patients and gnomAD variants from the same genes that were found in KND patients. (b) Allele frequency. The rare frequency portion of the left panel is seperately plotted in the right panel. (c) PhyloP and amino acid conservation. The solid lines denote medians and the dotted lines denote means. (d) CADD, GERP and SIFT score. (e) Recessive variants found from KND patients, o/e LoF values, and accumulated frequencies of LoF and ClinVar variants from gnomAD East Asians (EAS) for genes that harbor known pathogenic recessive variants in KND patients. Finally, portion that were attributable to ClinVar or LoF variants for pre-screening parents for each recessive gene are shown.

