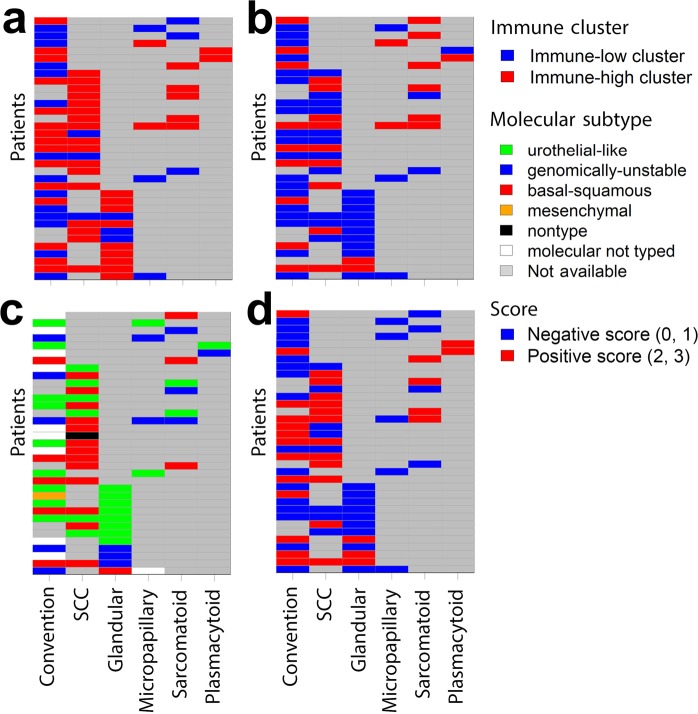
Figure 5.
Intra-tumoral immune heterogeneity in invasive urothalial carcinoma. Each row represents a patient and each column is a histologic variant. (a) Distribution of immune low and immune high cluster profile in different histologic variants from the same patient. (b) Distribution of PD-L1 scores in different histologic variants from the same patient. (c) Distribution of molecular subtypes in different histologic variants from the same patient. (d) Distribution of intra-tumoral CD3 scores in different histologic variants from the same patient.

