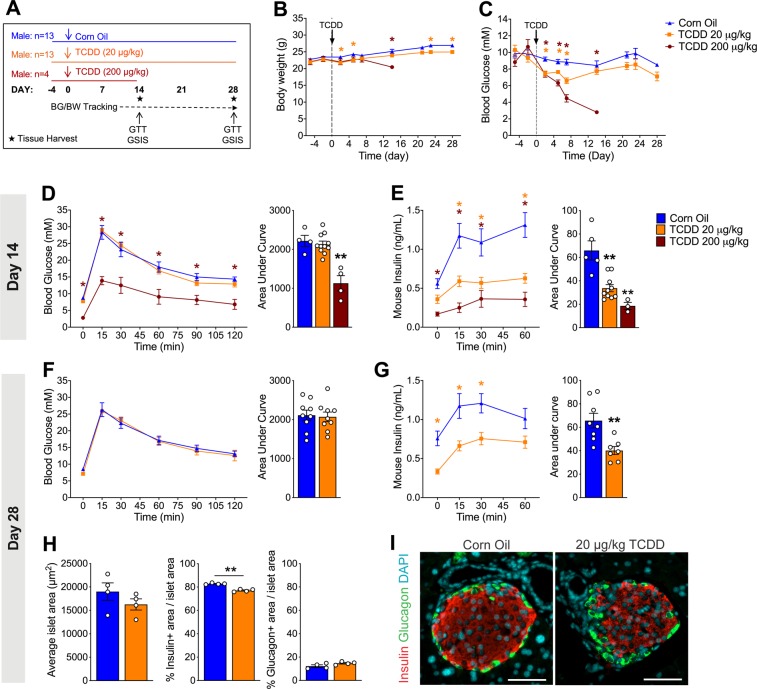
Figure 1.
Long-term reduction in plasma insulin levels, but normal glucose tolerance in vivo after a single 20 µg/kg dose of TCDD in male mice. (A) Schematic summary timeline of the study. Male mice were injected with either corn oil, 20 μg/kg TCDD, or 200 μg/kg TCDD on day 0 and followed for up to 4 weeks. BG = blood glucose; BW = body weight; GTT = glucose tolerance test; GSIS = glucose-stimulated insulin secretion. (B) Body weight and (C) blood glucose levels were measured after a morning fast throughout the study. (D,F) Blood glucose and (E,G) plasma insulin levels were measured during an i.p. GTT on day 14 (D,E) and day 28 (F,G). (H) Average islet area, and % of islet area that is immunoreactive for either insulin or glucagon. (I) Representative images of paraffin-embedded pancreas sections on day 28 after exposure to control or TCDD (20 μg/kg). Tissues are stained for insulin (red), glucagon (green), and DAPI (blue). Scale bars = 50 μm. All data are presented as mean ± SEM. Individual data points on bar graphs represent biological replicates (different mice). *p<0.05, **p<0.01 versus control. The following statistical tests were used: (B,C) days −5 to 14, two-way ANOVA with Dunnett test; day 21 to 28, two-way ANOVA with Sidak test; (D,E) line graphs: two-way RM ANOVA with Dunnett test; bar graphs, one-way ANOVA with Dunnett test; (F,G,H) line graphs, two-way RM-ANOVA with Sidak test; bar graphs, two-tailed unpaired t-test.

