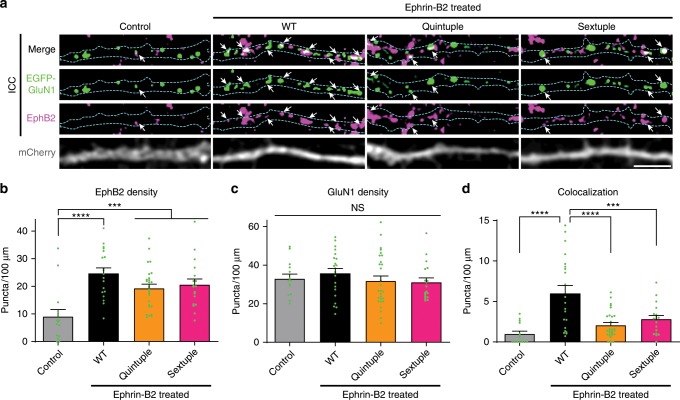
Fig. 3. GluN1 hinge mutants disrupt the EphB2–GluN1 interaction in neurons.
a Representative images of dendrites of DIV6-9 cortical neurons transfected with EGFP–GluN1 (WT, Quintuple, or Sextuple), mCherry, GluN2B, and CRISPR constructs to knock out endogenous GluN1. The control condition is WT GluN1-transfected treated with control reagents instead of ephrin-B2. The other three conditions were treated with ephrin-B2 for 45 min to induce the interaction between the NMDAR and EphBs. Top row panels show the colocalization between EGFP–GluN1 and EphB2 in white. Second row panels show the high contrasted images of EGFP–GluN1 puncta in green. Third row panels show the high contrasted images of endogenous EphB2 in magenta. Last row panels show mCherry. Outlines of morphology are shown in cyan. Scale bar = 5 µm. b Quantification of EphB2 density (puncta number per 100 µm) in indicated groups (***p < 0.005, ****p < 0.0001, ANOVA followed by Tukey’s; green dots represent Control n = 14; WT n = 21 cells; Quintuple n = 28; Sextuple n = 18). c Quantification of EGFP–GluN1 density (puncta number per 100 µm) in indicated groups (p = 0.5958, ANOVA; green dots represent Control n = 14; WT n = 21 cells; Quintuple n = 28; Sextuple n = 18). d Quantification of the effects of the different GluN1 mutants on colocalization (puncta number per 100 µm) between GluN1 and EphB2 (***p < 0.005, ****p < 0.0001, ANOVA; green dots represent Control n = 14; WT n = 21 cells; Quintuple n = 28; Sextuple n = 18).

