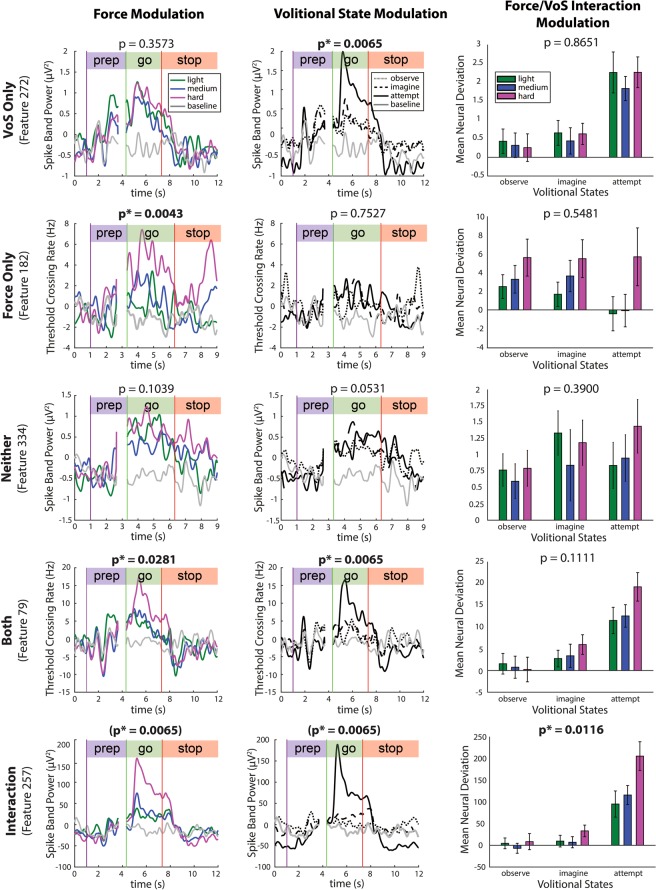
Figure 2.
Single features are tuned to force and volitional state. Rows: Average per-condition activity (PSTH) of five exemplary TC and SBP features tuned to force only (session 1), volitional state (VoS) only (session 4), neither factor (session 1), both factors (session 4), and an interaction between both factors (session 4) in participant T8 (2-way Welch ANOVA, corrected p < 0.05, Benjamini-Hochberg method). Neural activity was smoothed with a 100-ms Gaussian kernel prior to trial averaging to aid in visualization. Statistically significant p-values for force modulation, VoS modulation, and interaction are indicated with asterisks. Neural activity in Column 1 is averaged over all volitional states, such that observable differences in modulation are due to force alone (~50–90 trials per force level, depending on session number). Similarly, Column 2 depicts the activity of individual features during distinct volitional states, averaged over all force levels (~50–90 trials per volitional state, depending on session number). Simple main effects are represented graphically in Column 3 via normalized mean neural deviations from baseline activity during force trials within each of the three volitional states. Modulation depths were computed over the go phase of each trial, and then averaged within each force-VoS pair. Error bars indicate 95% confidence intervals.

