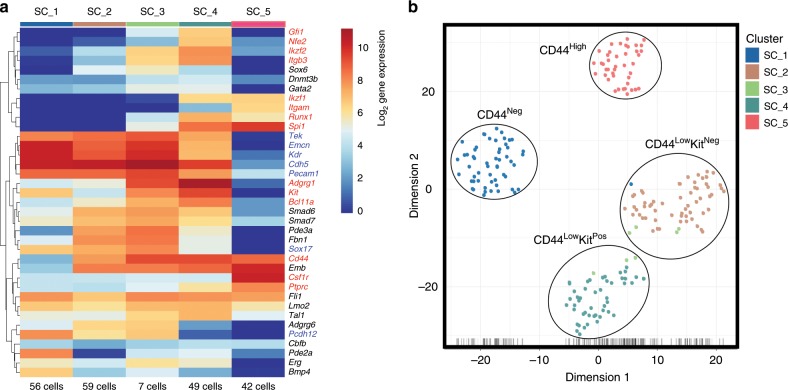
Fig. 3. The VE-Cad+ subpopulations defined by CD44 are transcriptionally distinct.
a Heatmap showing average expression of endothelial (blue), haematopoietic (red) and various (black) genes in the indicated groups (genes are clustered using Pearson’s correlation). The number of cells for each cluster is indicated at the bottom of the panel. Five groups are indicated. b tSNE plot from single-cell q-RT-PCR data shown in a. See also Supplementary Fig. 3, Supplementary Fig. 4 and Supplementary Data 3.

