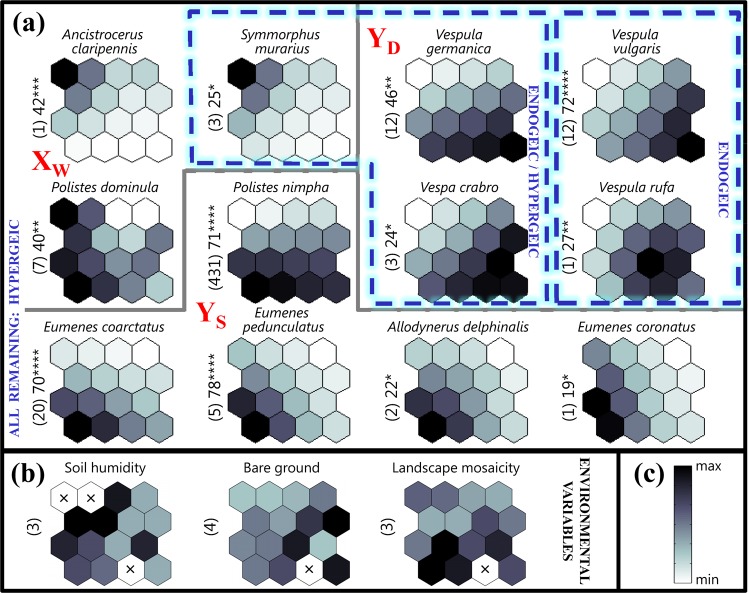
Figure 5.
The intensity of biological and environmental variables in the SOM regions (subclusters of output neurons; see Fig. 2). (a) The associations (p ≤ 0.05) of 12 indicator vespid species with the SOM regions (greyness based on virtual samples of vespid wasps). There were no such species for subcluster XL. The maximum indicator value (IndVal; based on real samples of vespid wasps) recorded for a given species and the respective significance level (p ≤ 0.05; **p ≤ 0.01; ***p ≤ 0.001; ****p ≤ 0.0001)) are presented on the left side of each species plane outside parentheses. Species with similar patterns over the SOM occurred in similar environmental conditions. (b) Selected environmental variables. × – empty neuron (i.e. without any assigned sample; see Fig. 2) or values not determined. The remaining explanations as in Fig. 4. (c) The scale. Shading (based on virtual samples in (a) and initial data in (b)) was scaled independently for each variable. The real values varied from zero to the maximum value presented on the left side of each plane in parentheses.

