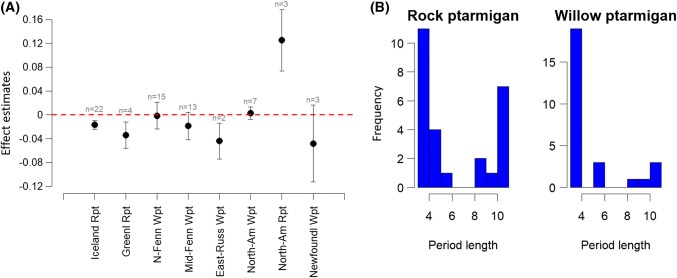
Fig. 2.
a Linear trend effect estimates (mean, confidence intervals and number of time series in regional meta-analyses) of rock ptarmigan (RPt) and willow ptarmigan (WPt) populations from different regions within or just outside the CAFF area (see Fig. 1; Table S2). b Frequencies (i.e. number of time series) of cycle period length (in years, based on dominant power spectrum) from wavelet analyses of rock ptarmigan and willow ptarmigan time series

