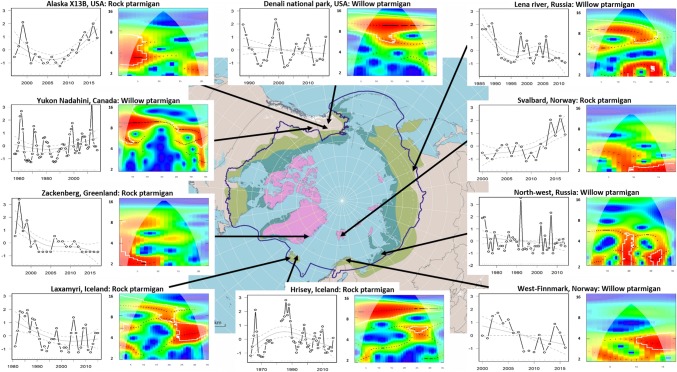
Fig. 3.
Representative examples of 10 long time series and monitoring sites illustrating the variety of populations dynamics and trends displayed by the two ptarmigan species (willow and rock ptarmigan) in the circumpolar Arctic. The left panels for each site show the standardized time series and GAM trend curves (grey lines) with confidence envelopes (grey dotted lines). The right panels show the result from the wavelet analyses where red areas, within white wavelet power contour lines, denote periods with evidence for cyclic dynamics with different cycle lengths. The colour palette in the wavelet plots denotes wavelet power levels, with wavelet power increasing from blue to red

