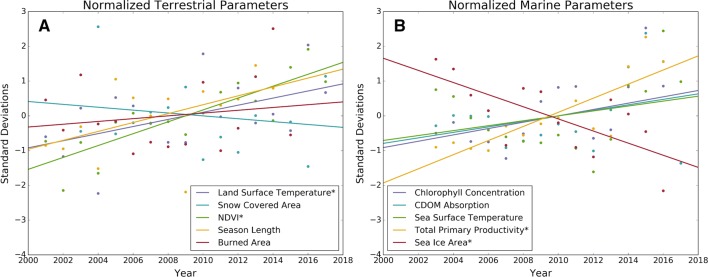
Fig. 3.
Average annual standardized data have been plotted for the pan-Arctic to show rates of change among the different parameters and compare the terrestrial (a) with the marine (b) environments. Statistically significant trends are marked with an * in the legend. Detailed statistics for the trends are available in Table 2

