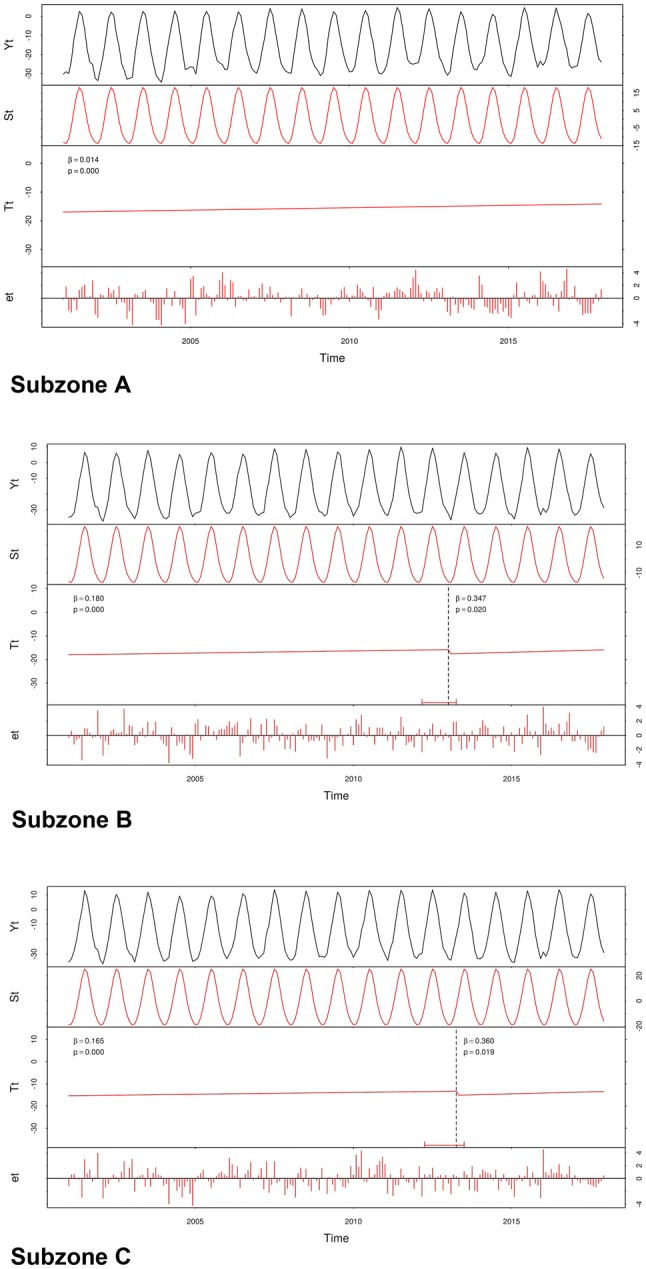
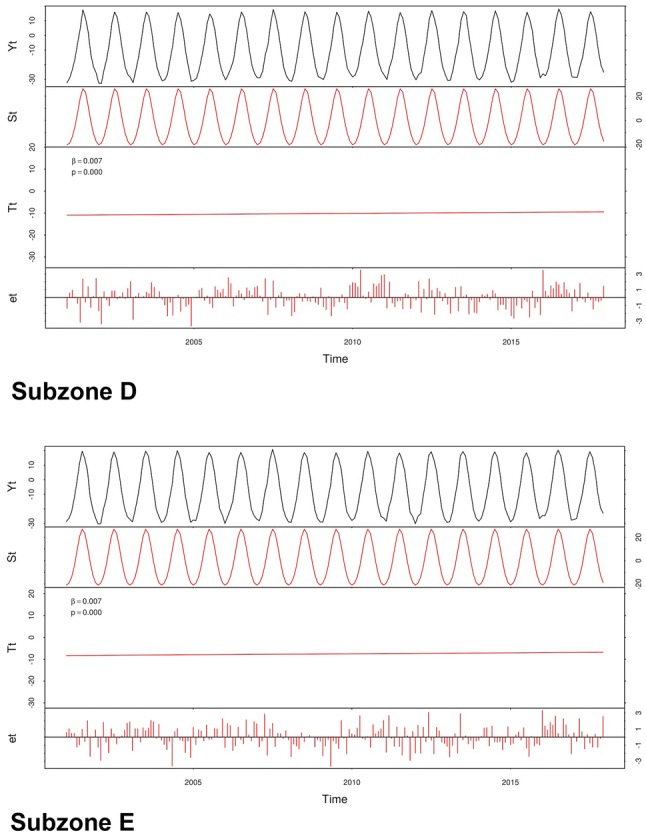
Fig. 4.


Results from the BFAST changepoint analysis on the seasonal land surface temperature data show breaks in the trends in subzones B and C occurring in 2013 for both subzone. The trends for all subzones are statistically significant as indicated by the respective p values printed in panel three of each subzone output. The output graphs show the fully plotted data in the top panel, followed by the seasonal trends. The third panel in each output shows the annual trend and any identified breaks in trend with associated error bars. The fourth panel shows the residual differences from the trend
