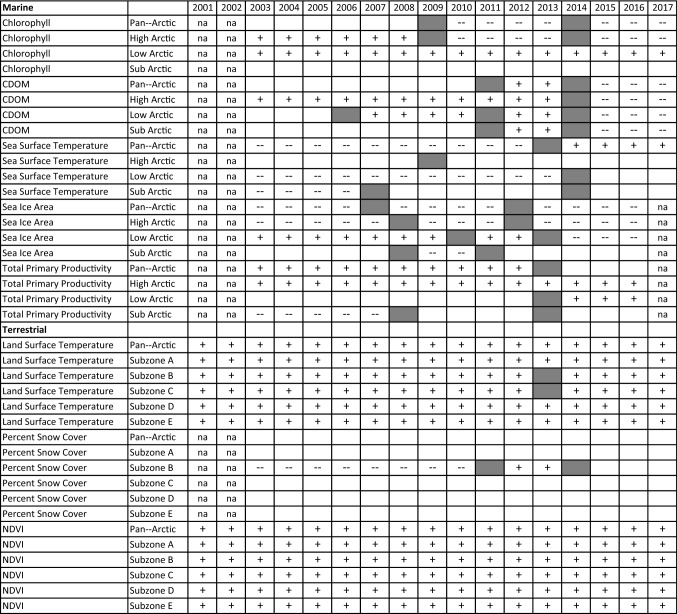
Table 3.
Summary table showing the BFAST-derived trends and changepoints for parameters with seasonal data. + indicates a statistically significant increasing trend, ![]() indicates a decreasing trend, and empty cells indicate a non-significant trend. Grey cells indicate that a significant shift in the trend occurred in that year
indicates a decreasing trend, and empty cells indicate a non-significant trend. Grey cells indicate that a significant shift in the trend occurred in that year

