
Figure 1.
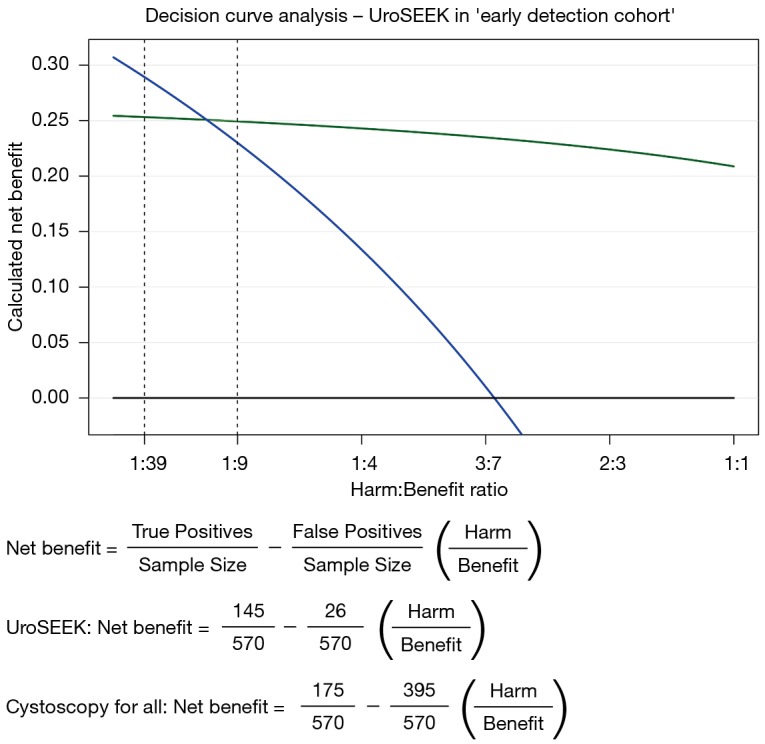
Decision curve analysis of the UroSEEK assay with corresponding net benefit formulas. Shown are calculated net benefit plots for ‘cystoscopy for all’ (blue line), ‘cystoscopy for none’ (black line) and the UroSEEK assay ‘green line’.
Official websites use .gov
A
.gov website belongs to an official
government organization in the United States.
Secure .gov websites use HTTPS
A lock (
) or https:// means you've safely
connected to the .gov website. Share sensitive
information only on official, secure websites.
Decision curve analysis of the UroSEEK assay with corresponding net benefit formulas. Shown are calculated net benefit plots for ‘cystoscopy for all’ (blue line), ‘cystoscopy for none’ (black line) and the UroSEEK assay ‘green line’.