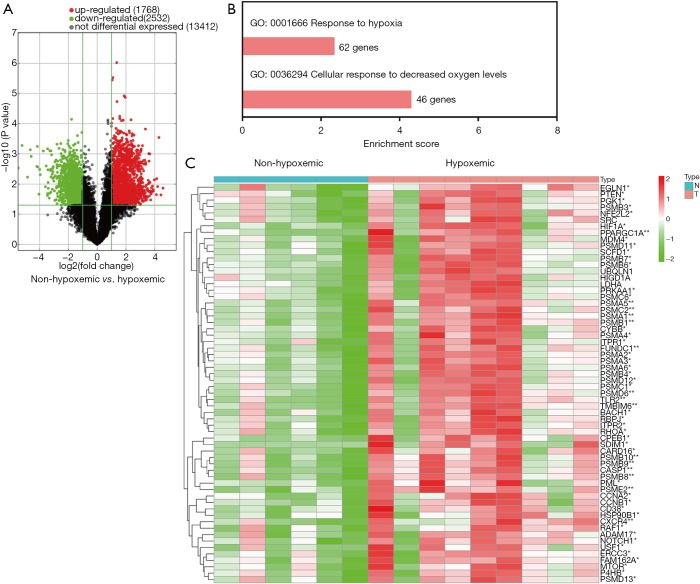
Figure 1.
Volcano plot of significantly differential experiment genes and significant GO analyses related to cell response to hypoxia. (A) Analyzing the differentially expressed genes by t test, log2FC was taken as abscissa and negative logarithm-log10 (P value) of P value was taken as ordinate; (B) the significant GO of differentially expressed genes related to cell response to hypoxia; (C) the details of differentially expressed genes in GO function related to cell response to hypoxia. *, P<0.05; **, P<0.01. GO, gene ontology.

