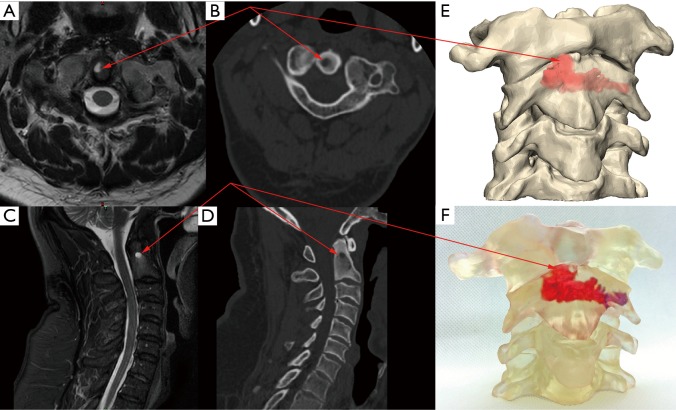
Figure 5.
Medical imaging, virtual reconstruction and physical manifestation of C2 vertebral body tumour. (A) and (C) are axial and sagittal (respectively) T2 weighted MRI slices showing the ‘hot spot’ of tumour activity; (B) and (D) show axial and sagittal (respectively) CT slices in the same positions as (A) and (C) showing the lesion; (E) virtual reconstruction of cervical osteology (C1-midway C4) anatomy showing internal lesion (red); (F) 3DP clear model of E with the lesion coloured according to MRI signal—brighter red associated with high intensity of MRI signal, blue/purple associated with lower intensity MRI signal.

