
Figure 3.
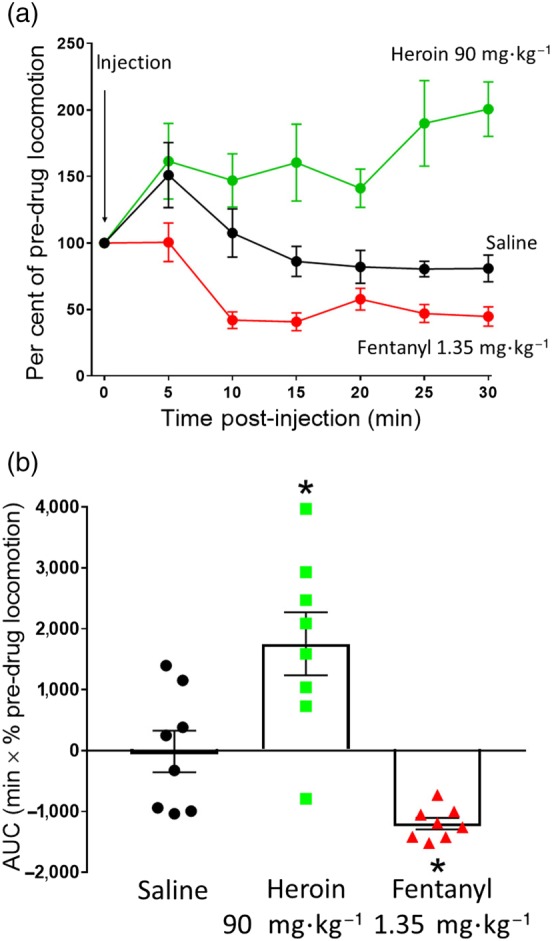
Change in mouse locomotor activity following heroin or fentanyl administration. (a) Saline (i.p.), heroin (90 mg·kg−1 i.p.), or fentanyl (1.35 mg·kg−1 i.p.) were administered to mice and locomotor activity measured. Heroin caused a sustained increase in locomotor activity compared to saline, whereas fentanyl caused a decrease in locomotor activity compared to saline. (b) AUC analysis of data in (a). Statistical comparison in (b) made using one‐way ANOVA with Bonferroni's comparison. * indicates P < .05 compared to saline. n = 8 for each group