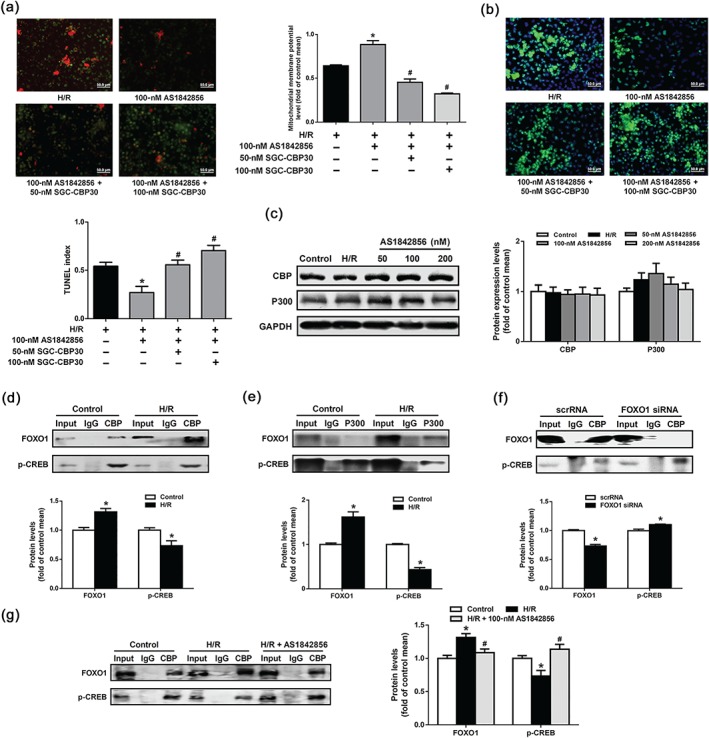
Figure 7.

FOXO1 suppressed PGC‐1α transcription by competing with CREB to bind https://www.guidetopharmacology.org/GRAC/ObjectDisplayForward?objectId=2734/https://www.guidetopharmacology.org/GRAC/ObjectDisplayForward?objectId=2737. (a) Mitochondrial transmembrane potential levels in HK2s among groups. Data were expressed as mean ± SEM, n = 5 per group, * P < .05 versus H/R, # P < .05 versus H/R with 100‐nM AS1842856. (b) HK2s were subjected to TUNEL staining. Representative images of TUNEL staining in different groups. Scale bar: 50 μm. Data are shown as mean ± SEM, n = 5 per group, * P < .05 versus H/R, # P < .05 versus H/R with 100‐nM AS1842856. (c) https://www.guidetopharmacology.org/GRAC/ObjectDisplayForward?objectId=2734 and https://www.guidetopharmacology.org/GRAC/ObjectDisplayForward?objectId=2737 protein levels in HK2s among groups were monitored by Western blot analysis. Data are presented as histograms. Data are shown as mean ± SEM. n = 6 per group. (d) Western blot analysis of a coimmunoprecipitation experiment in HK2s under control or H/R condition. The protein extracting solution of HK2s were immunoprecipitated with anti‐https://www.guidetopharmacology.org/GRAC/ObjectDisplayForward?objectId=2734 or IgG. FOXO1 and p‐CREB were visualized by Western blot analysis. Data are shown as mean ± SEM of five independent experiments. * P < .05 versus control. (e) Western blot analysis of a coimmunoprecipitation experiment in HK2s under control or H/R condition. The protein extracting solution of HK2s were immunoprecipitated with anti‐https://www.guidetopharmacology.org/GRAC/ObjectDisplayForward?objectId=2737 or IgG. FOXO1 and p‐CREB were visualized by Western blot analysis. Data are shown as mean ± SEM of five independent experiments. * P < .05 versus control. (f) Western blot analysis of a coimmunoprecipitation experiment in HK2s under scrRNA and FOXO1 siRNA transfection. The protein extracting solution of HK2s were immunoprecipitated with anti‐https://www.guidetopharmacology.org/GRAC/ObjectDisplayForward?objectId=2734 or IgG. FOXO1 and p‐CREB were visualized by Western blot analysis. Data are shown as mean ± SEM of five independent experiments. * P < .05 versus scrRNA. (g) Western blot analysis of a coimmunoprecipitation experiment in HK2s under control‐, H/R‐, or AS1842856‐treated condition. The protein extracting solution of HK2s were immunoprecipitated with anti‐https://www.guidetopharmacology.org/GRAC/ObjectDisplayForward?objectId=2734 or IgG. FOXO1 and p‐CREB were visualized by Western blot analysis. Data are shown as mean ± SEM of five independent experiments. * P < .05 versus control, # P < .05 versus H/R with 100‐nM AS1842856
