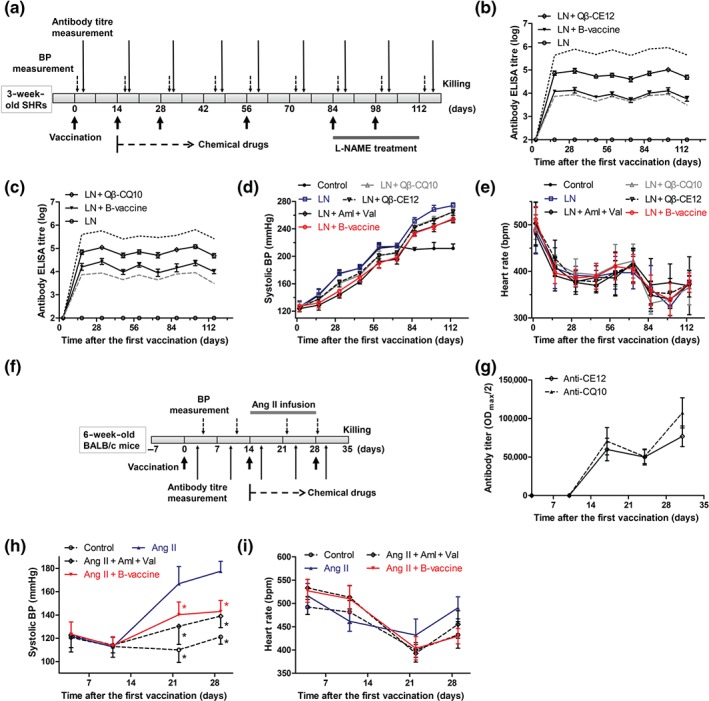
Figure 4.

Antihypertensive effect of HBcAg‐CE12‐CQ10 vaccine in hypertensive rodents. (a) Schematic timeline for the study of effects of HBcAg‐CE12‐CQ10 vaccination in spontaneously hypertensive rats (SHRs). (b) Anti‐CE12‐specific antibody in response to immunization in SHRs (ELISA on serum samples, n = 8 per group). The black solid lines indicate antibodies against CE12, the black dotted line indicates antibody against Qβ induced by Qβ‐CE12 vaccination, and the grey dashed line indicates antibody against HBcAg induced by HBcAg‐CE12‐CQ10 vaccination. (c) Anti‐CQ10‐specific antibody in response to immunization in SHRs (ELISA on serum samples, n = 8 per group). The black solid lines indicate antibodies against CQ10, the black dotted line indicates antibody against Qβ induced by Qβ‐CQ10 vaccination, and the grey dashed line indicates antibody against HBcAg induced by HBcAg‐CE12‐CQ10 vaccination. (d) Systolic BP in response to immunization in SHRs (n = 8 per group). (e) Heart rate of the SHRs (n = 8 per group). (f) Schematic timeline for the study of effects of HBcAg‐CE12‐CQ10 vaccination in BALB/c mice. (g) Antibody titres in response to immunization in BALB/c mice (ELISA on serum samples, n = 8 per group). (h) Systolic BP in response to immunization in BALB/c mice (n = 8 per group). * P < .05 versus Ang II. (i) Heart rate of the BALB/c mice (n = 8 per group). Data are expressed as mean ± SEM, analysed by two‐way repeated measures ANOVA. Aml, amlodipine; B‐vaccine, bivalent HBcAg‐CE12‐CQ10 vaccine; LN, L‐NAME; Val, valsartan
