
Figure 2.
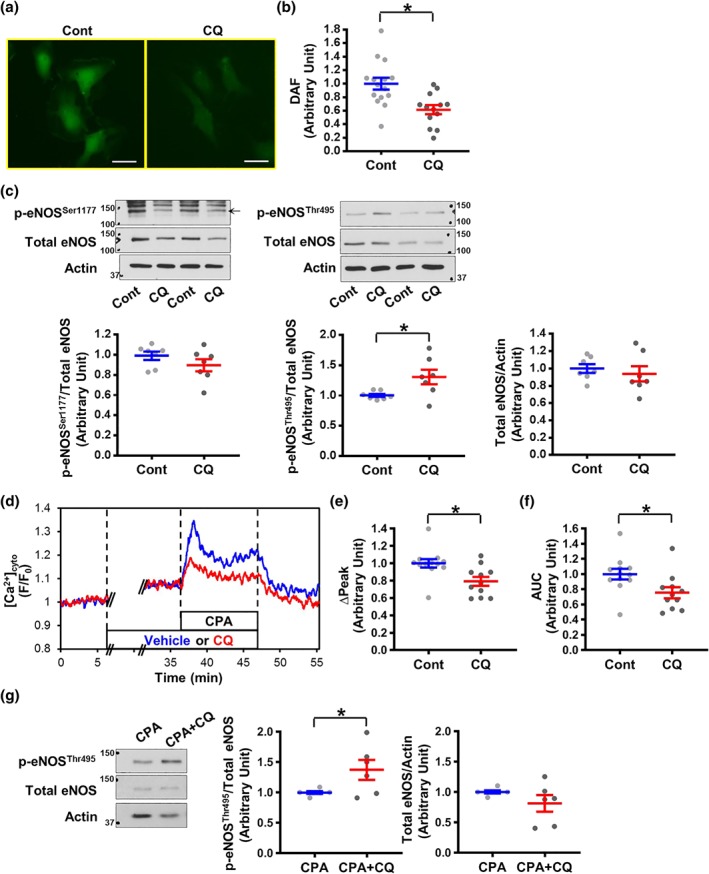
CQ decreases cytosolic NO level, increases phosphorylated eNOS495, and attenuates the rise in cytosolic Ca2+ concentration after stimulation in human coronary endothelial cells. (a) Representative images showing NO signals, determined by DAF, in human coronary endothelial cells (HCECs) with or without (w/o) CQ treatment for 30 min. Bar = 50 μm. (b) Summarized data showing DAF intensity in control cells (Cont, n experiment = 15, n cells = 127) and CQ‐treated cells (CQ, n experiment = 13, n cells = 118). Data are mean ± SE. *P < .05 compared to Cont. (c) WB analysis on total eNOS, phosphorylated eNOS at Ser1177 (p‐eNOSser1177), and Thr495 (p‐eNOSThr495) in control HCECs (Cont) and CQ‐treated HCECs (CQ). Actin was used as a loading control. The scattered plots show the level of p‐eNOS normalized to total eNOS (left panels) and the level of total eNOS normalized to actin (right panel). n experiment = 7. Data are mean ± SE. *P < .05 compared to Cont. (d) Representative records showing cytosolic Ca2+ concentration ([Ca2+]cyto) in HCECs before, during, and after stimulation with cyclopiazonic acid (CPA, an inhibitor of sarcoplasmic reticulum Ca2+‐ATPase to increase [Ca2+]cyto, 10 μM) in the absence (vehicle, blue tracing) or presence (CQ, red tracing) of CQ. (e,f) Summarized data showing the amplitude (∆Peak, e) and the AUC (f) of CPA‐induced increase in [Ca2+]cyto in control cells (Cont, n experiment = 12, n cells = 120) and CQ‐treated cells (CQ, n experiment = 11, n cells = 110). Data are mean ± SE. *P < .05 compared to Cont. (g) The level of p‐eNOSThr495 after the treatment of CPA with or without CQ. n experiment = 6. Data are mean ± SE. *P < .05 compared to CPA. Unpaired Student's t‐test was used for comparisons of two experimental groups in Figure 2b,c,g. Mann–Whitney test was used for Figures 2e,f