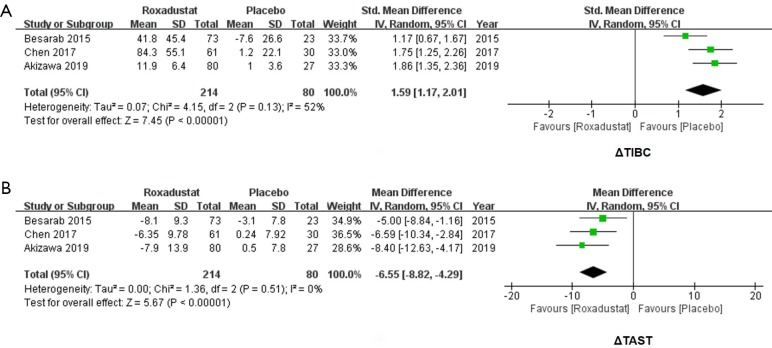
Figure 5.
Forest plots for comparisons of Δtotal iron binding capacity (TIBC) and Δtransferrin saturation (TAST). Meta-analysis of ΔTIBC showed a significant increase of roxadustat groups compared with placebos (SMD =1.59, 95% CI: 1.17 to 2.01, I2=52%, P<0.00001, A). ΔTAST of probiotics groups showed a decrease (WMD =−6.55, 95% CI: −8.82 to −4.29, I2=0%, P<0.00001, B). WMD, weighted mean difference.

