
Figure 1.
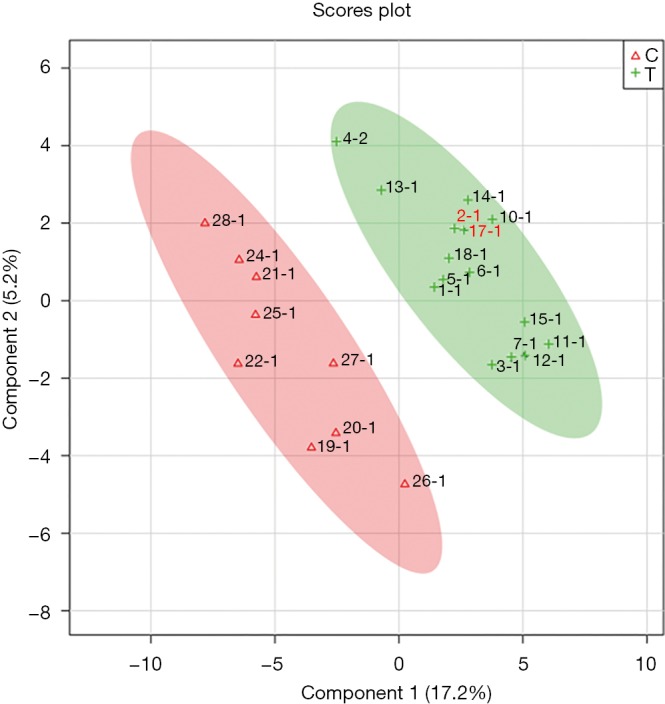
2D scores plot showing PLS-DA discrimination between plasma samples of CRC patients (T, green) and controls (C, red). The shaded areas indicate the 95% confidence regions. PLS-DA, partial least square-discriminant analysis; CRC, colorectal cancer.