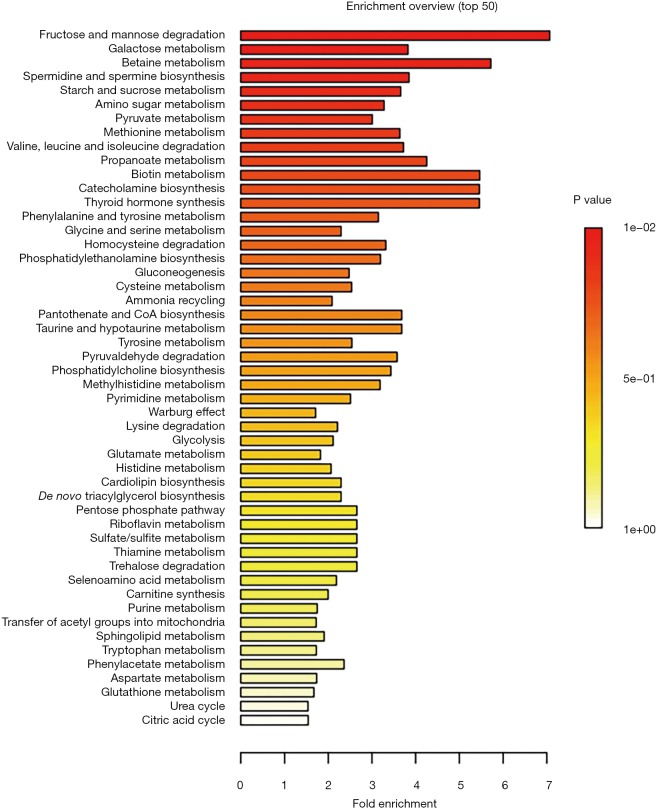
Figure 3.
Graphic synopsis of Metabolite Sets Enrichment Analysis (MSEA). Results are expressed by a horizontal bar graph showing the most significant metabolites sets identified during analysis. Bars color is based on P values (lower P values correspond to a darker red) while bars length is based on the fold enrichment.

