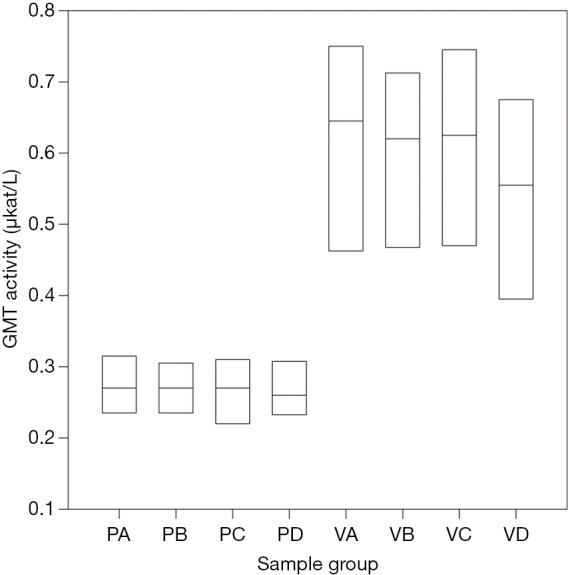
Figure 3.

Comparison of gamma-glutamyl transferase (GMT) levels during the experiment in the control and intervention group using one-way variance analysis (ANOVA). P, control group; V, intervention group; A, level at the introduction of general anesthesia; B, level before the HD ligament clamp; C, level after 2 hours of ischemia; D, level after 2 hours of reperfusion. The differences between the intervention group (VA–VD) and control group (PA–PD) are statistically significant (P<0.001).
