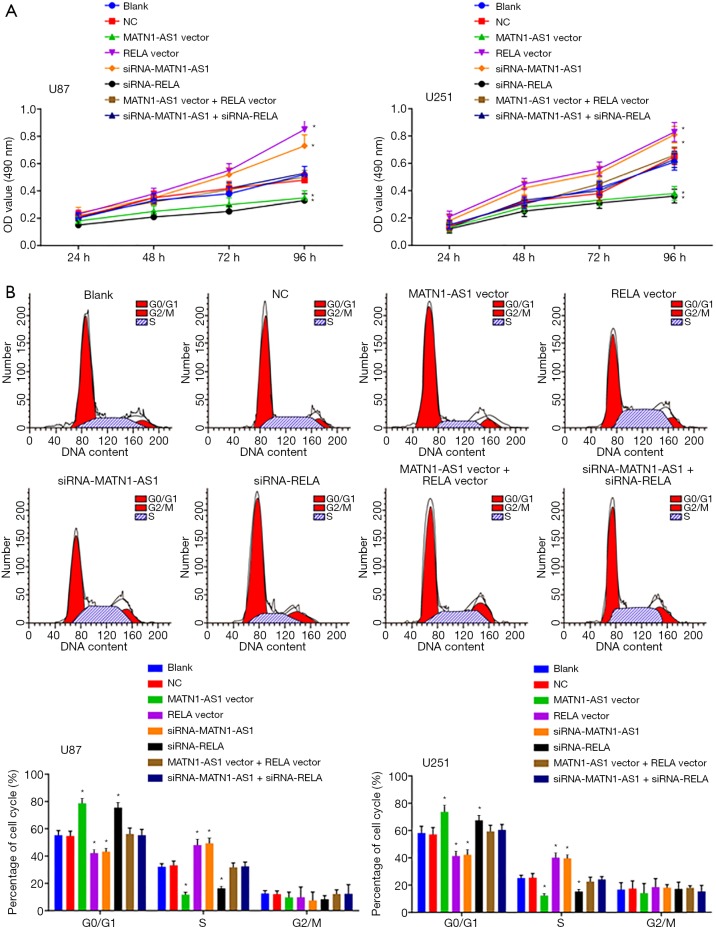
Figure 3.
MATN1-AS1 suppressed GBM cell proliferation through inhibition of RELA. (A) Proliferation of U87 (left) and U251 (right) cells. After transfection, cell proliferation was assessed by the MTT assay. Vertical axis: optical density (OD) value; horizontal axis: time (h); (B) cell cycle analysis by flow cytometry. Representative histograms of flow cytometry (upper panel) and quantitative comparison (lower panel) of changes in cell cycle of U87 cells (left) and U251 cells (right). Data are presented as the mean ± standard deviation. *, P<0.05 vs. the NC and blank groups. GBM, glioblastoma; NC, negative control.

