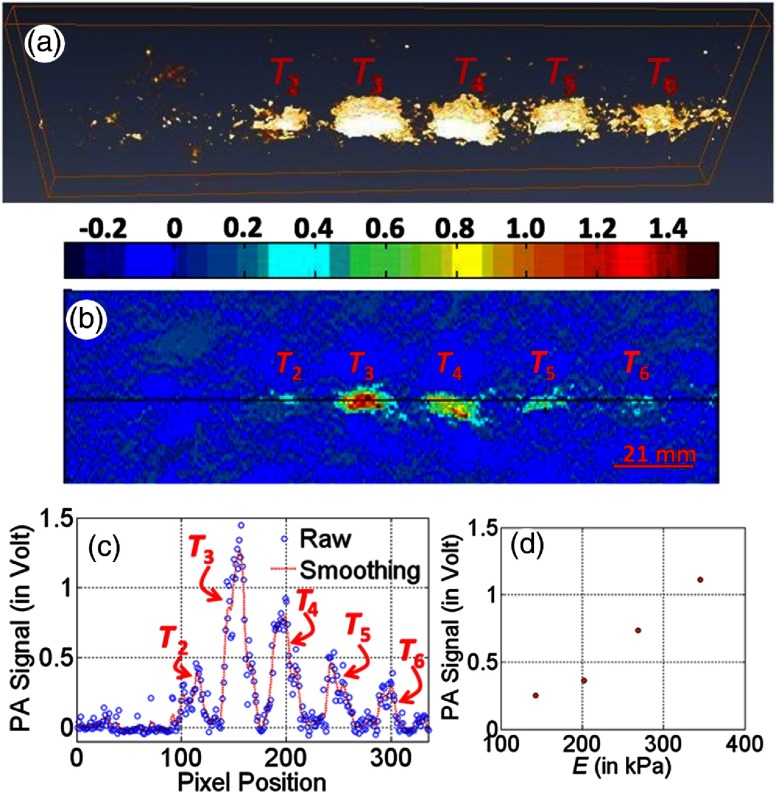
Fig. 4.
3-D reconstructed image (a) of PA signals obtained from a sequence of 2-D PA-representative images (b) by employing Amira software. (c) Line plot showing the variation of PA signals along the line as marked in (a). (d) Variation of PA signals (as obtained from target regions) with Young’s modulus, . Experiments were performed in sample depicted in Fig. 3(a) while a tightly focusing transducer of operating frequency 50 MHz was employed as acoustic sensor.

