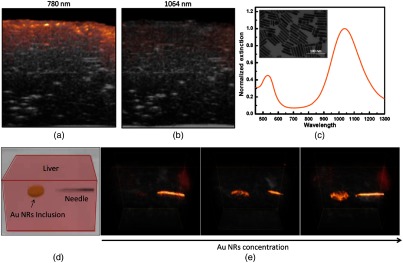
Fig. 3.
Combined US (gray) and photoacoustic (red) images of an ex vivo bovine liver at wavelengths of (a) 780 nm and (b) 1064 nm. (c) Optical spectrum of gold (Au) nanorods (inset shows a TEM image of the Au nanorod, the scale bar is 100 nm). (d) Schematic illustration of the liver phantom with Au nanorod inclusions and one embedded needle. (e) Combined PA/US images of the liver phantom captured at 1064 nm with increasing concentrations of Au nanorods in the inclusion from left to right (5, 12.5, and , respectively). Reproduced with permission from Ref. 124.

