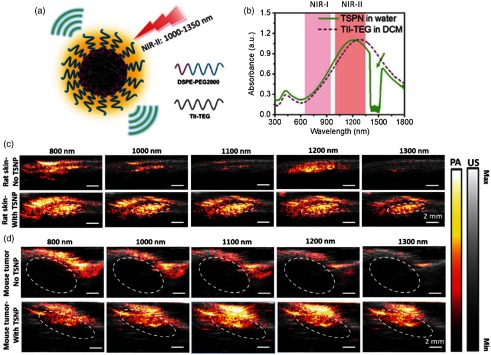
Fig. 9.
(a) Schematic illustration of TSPNs prepared by nanoprecipitation. (b) Absorption spectra of TSPN in water (solid green line) and TII-TEG in dichloromethane (dashed purple line). The dip in the green curve is due to the strong absorption of water between 1400 and 1500 nm. In vivo PA/US imaging of TSPN in rat skin (c) without injection of TSPNs (upper) and with injection of , matrigel inclusions of TSPNs (lower), and in mouse tumor (dashed circles); (d) without injection of TSPNs (upper) and with injection of , aqueous solution of TSPNs (lower). The laser energy density is at 800 nm, at 1000 nm, at 1100 nm, at 1200 nm, and at 1300 nm. Each image is normalized with the corresponding laser energy density. Reproduced with permission from Ref. 169.

