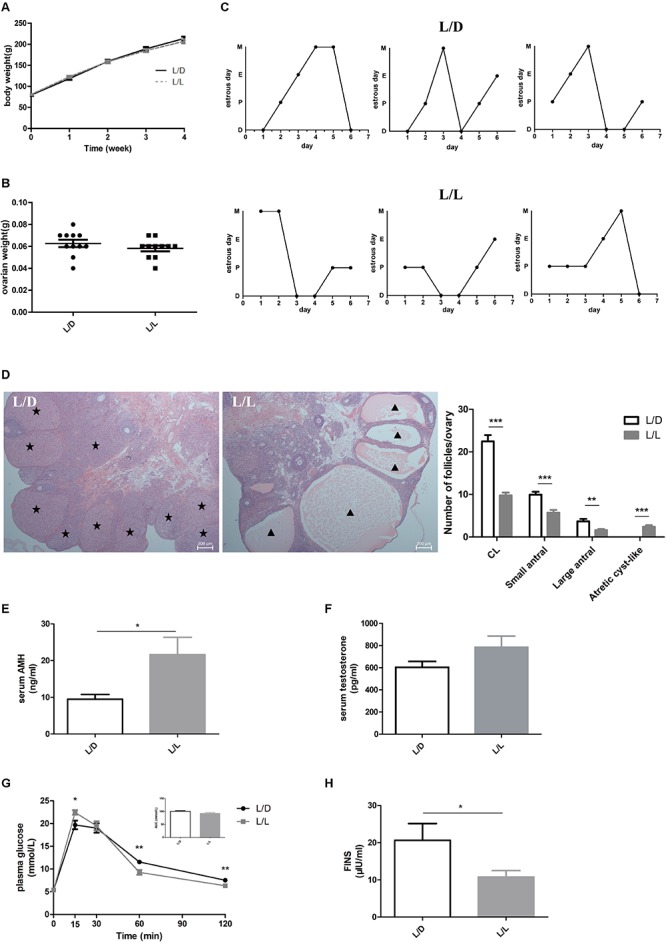
FIGURE 1.

Continuous light-induced PCOS-like changes in SD rats. (A) The average weekly BW of each group of rats. (B) The ovarian weight of each group of rats. (C) Representative estrous cycles of two groups. The upper and lower panels represent the L/D and L/L groups, respectively. D, diestrus; P, proestrus; E, estrus; M, metestrus. (D) Representative examples of ovarian HE-stain histology and average numbers of follicles and CL per ovary in L/D and L/L group. (E) Serum AMH concentration. (F) Serum T concentration. (G) Glucose tolerance test and the areas under the curves. (H) Fasting insulin level. Star, CLs; triangle, arrested antral follicle. CL, corpora lutea. N = 11/group. Values are expressed as means ± SEM. Significant differences between the two groups are indicated by asterisks (∗P < 0.05, ∗∗P < 0.01, ∗∗∗P < 0.001).
