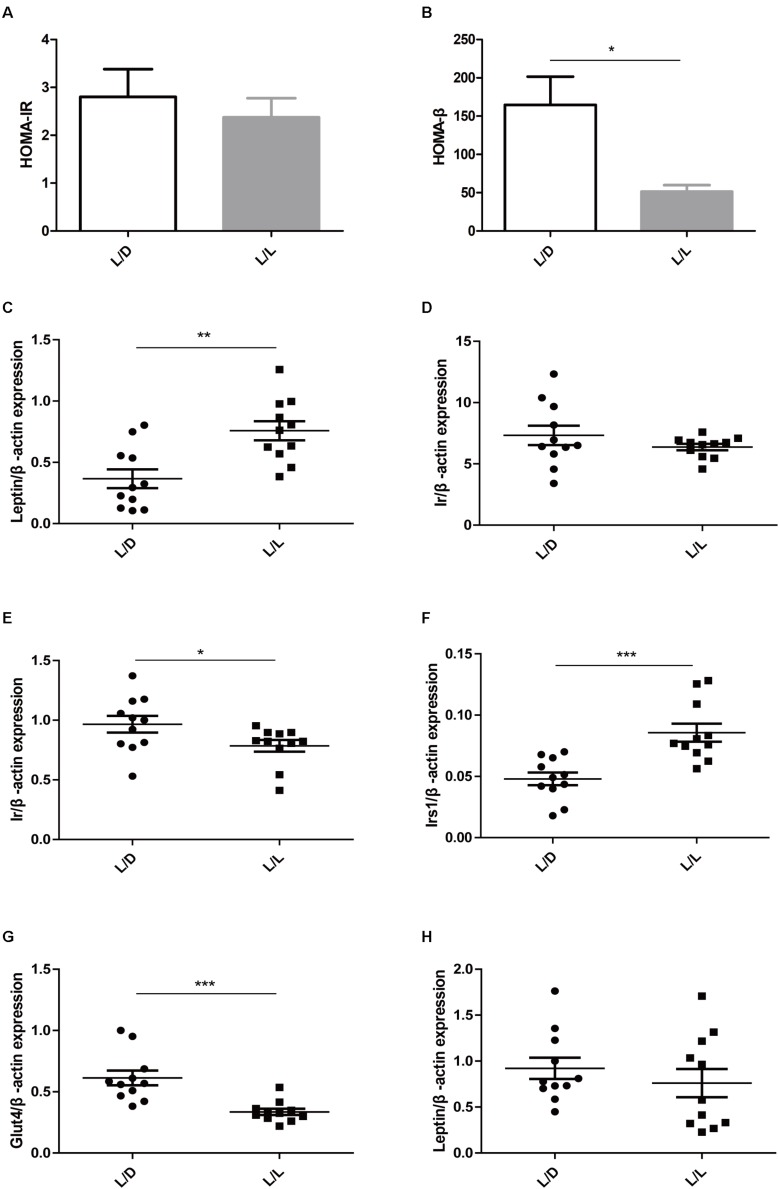
FIGURE 2.
Continuous light resulted in impaired glucose metabolism in liver, adipose tissue, and muscle. (A) HOMA-IR. (B) HOMA-β. (C,D) The mRNA abundance of Leptin and Ir in liver tissue, respectively. (E,F) The mRNA abundance of Ir and Irs1 in adipose tissue, respectively. (G,H) The mRNA abundance of Glut4 and Leptin in muscle, respectively. N = 11/group. Values are expressed as means ± SEM. Significant differences between the two groups are indicated by asterisks (∗P < 0.05, ∗∗P < 0.01, ∗∗∗P < 0.001).

