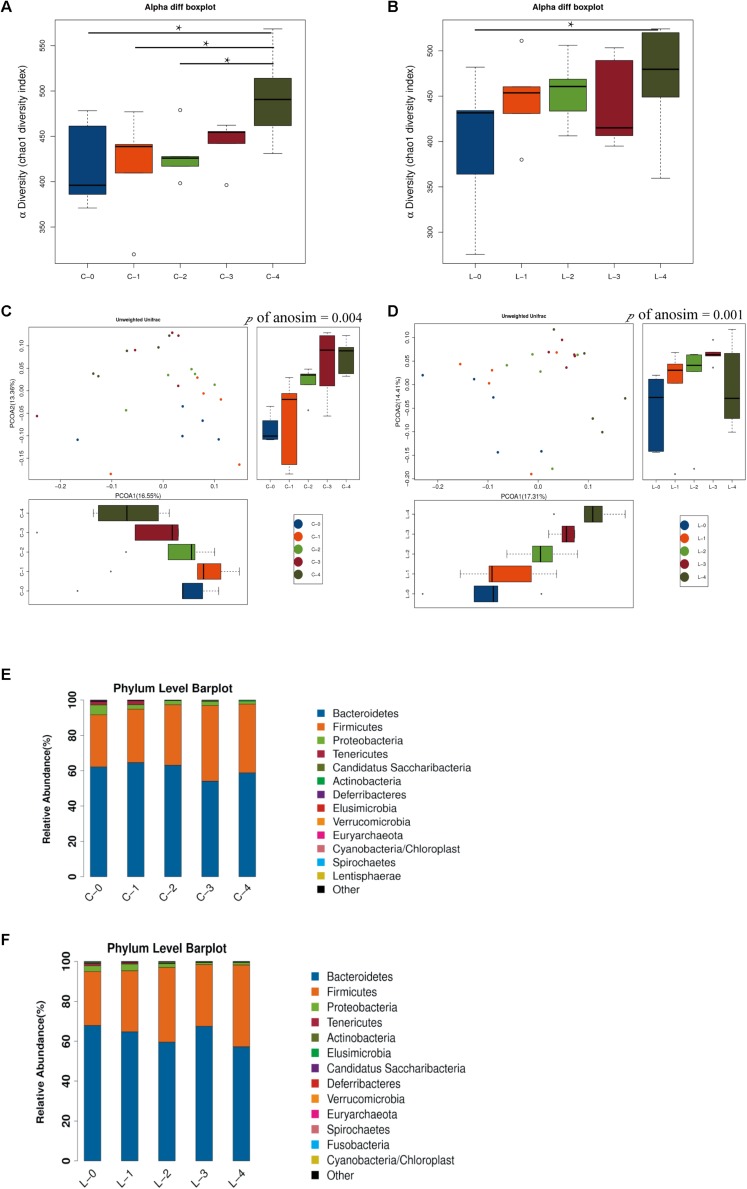
FIGURE 3.
Time-dependent alterations of gut microbiota community in L/D group and L/L group. (A,B) Boxplots of α-diversity (Chao1 diversity index) among time points in the L/D and L/L groups, respectively. (C,D) PCoA plot with different relative abundances of OTUs among time points in the L/D and L/L groups, respectively. (E,F) Taxonomic compositions of bacterial communities in phylum level among time points in the two groups. C-0, C-1, C-2, C-3, C-4 indicated the clusters of samples collected at the weekly time point in the L/D group of rats, respectively. L-0, L-1, L-2, L-3, L-4 indicated the clusters of samples collected at the weekly time point in the L/L group of rats. N = 5/group. One-way ANOSIM analysis was performed to show the differences among time points. Significant differences between groups were indicated by P < 0.05.

