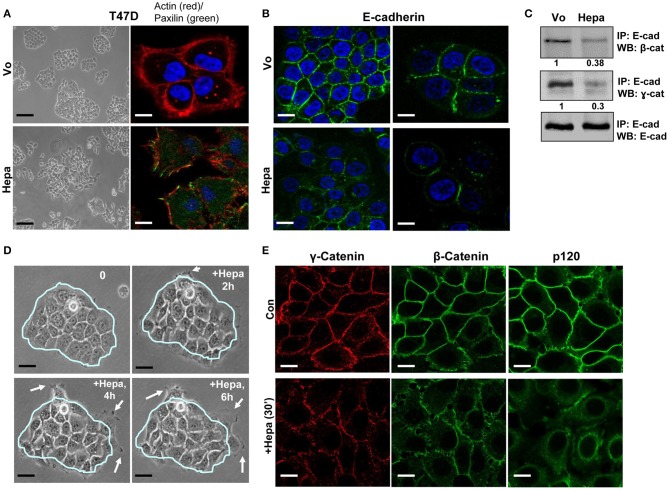
Figure 1.
Heparanase affects cell-cell contacts and disrupts AJ. (A) Dispersed cell colonies. T47D breast carcinoma cells were transfected with an empty vector (Vo) or heparanase gene construct (Hepa), and their growth pattern was examined. Shown are representative cell cultures. Note that while control (Vo) cells grew in typical well-organized colonies, heparanase overexpressing cells show dispersed cell colonies (left panels). Control (Vo) and heparanase overexpressing cells were fixed with 4% PFA and following permeabilization were stained with phalloidin-TRITC to label the actin cytoskeleton (red), and paxillin (green) that typically labels adherent junctions (right panels). Note abundant paxillin staining in heparanase overexpressing cells. Scale bars represent 60 (left panels) and 10 microns (right panels). (B) Decreased E-cadherin staining in heparanase cells. Control (Vo) and heparanase overexpressing cells (Hepa) were subjected to immunofluorescent staining applying anti-E-cadherin antibody. Shown are representative images (confocal microscopy) at ×100 (left) and ×200 (right) magnifications merged with nuclear labeling (DAPI; blue). Note decreased E-cadherin at cell-cell borders upon heparanase overexpression. Scale bars represent 20 (left panels) and 10 (right panels) microns. (C) Immunoprecipitation. Lysates of control (Vo) and heparanase overexpressing cells (Hepa) were subjected to IP applying anti-E-cadherin antibody, followed by immunoblotting with anti-β-catenin (upper panel), ɤ-catenin (second panel), and anti-E-cadherin (lower panel) antibodies. Densitometry analysis of protein band intensity is shown below each panel in relation to its level in control (Vo) cells, set arbitrarily to a value of 1. Note decreased association of E-cadherin with catenins in heparanase cells. (D) Exogenous addition. T47D cells were seeded at low density, and cell colonies were allowed to form. Colonies were then photographed and their morphology was inspected over time following treatment with latent heparanase added exogenously (1 μg/ml) to the cell culture medium. Shown is a typical colony before (0) and after the addition of heparanase for 2, 4, and 6 h. Note that cells are migrating out of the colony (white arrows) after the addition of heparanase. Scale bars represent 30 microns. (E) Immunofluorescent staining. T47D cells were left untreated (Con) or were treated for 30 min with latent heparanase (1 μg/ml) added exogenously to the cell culture medium. Cells were then fixed, permeabilized, and subjected to immunofluorescent staining applying anti-ɤ-catenin (left panels), anti-β-catenin (middle panels), and anti-p120-catenin (right panels) antibodies. Note decreased and less organized staining of the catenins following the addition of heparanase. Scale bars represent 10 microns.

