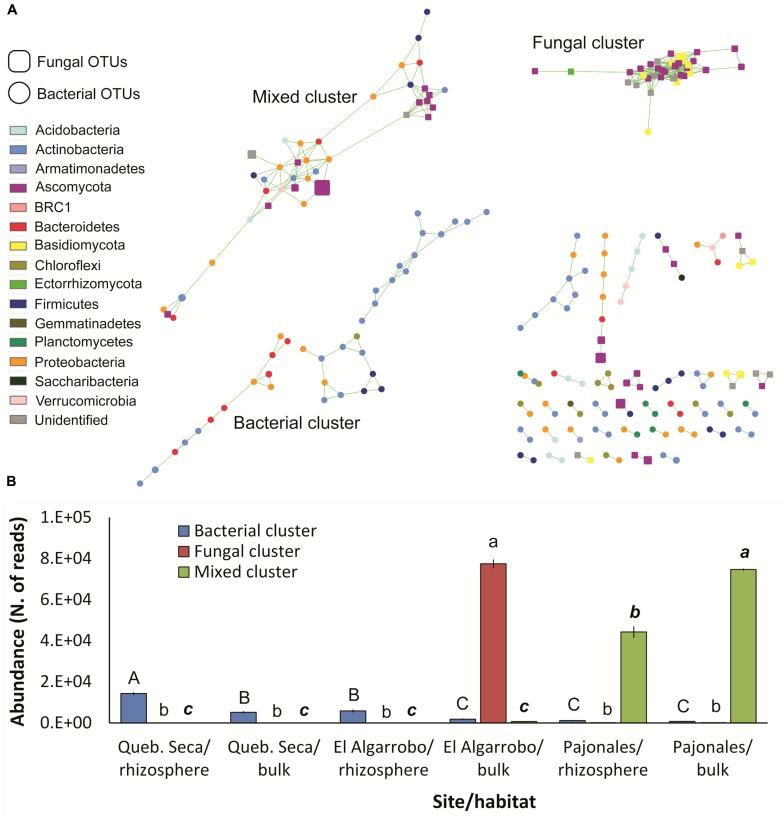
FIGURE 4.
Network analysis of the bacterial-fungal microbiome associated to C. longiscapa during the Atacama flowering desert event. (A) Bacterial and fungal OTUs (round and squared nodes, respectively) are correlated to each other if connected by a green line. Node size indicates the respective mean OTU abundance. Node color indicates the taxonomic affiliation. The three main clusters detected are labeled. (B) Distribution of the three clusters across the three sites and the two habitats (rhizosphere/bulk). Different letters indicates significantly different means for each cluster (Tukey test, p < 0.05).

