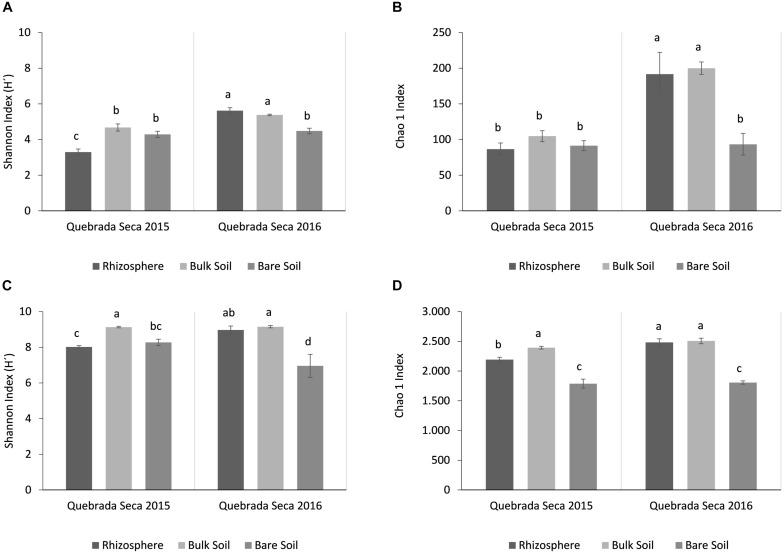
FIGURE 5.
Alpha-diversity analysis per year and sample type (rhizosphere, bulk soil, bare soil). (A) Shannon Index for fungi; (B) Chao1 Index for fungi; (C) Shannon Index for prokaryotes; (D) Chao1 Index for prokaryotes. Different letters above the bars indicate statistically different means (Tukey test, p < 0.05).

