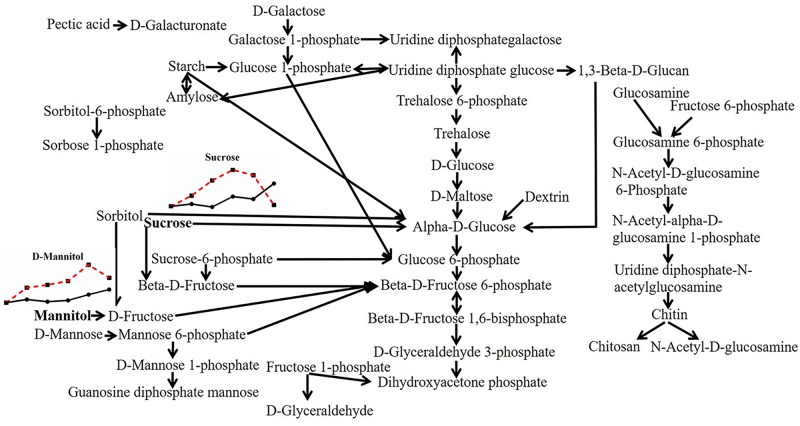
FIGURE 3.
Metabolic pathway of fungal saccharides and changes in differential metabolites in P. ostreatus under heat stress. The differential substances are shown in bold letters. The change in metabolites with temperature is represented by a line chart (average), in which the 28°C group is represented by a solid black line with black dots, and the 40°C group is represented by a red dotted line with black squares; the dots or squares indicate 0, 6, 12, 24, 48, and 48 + 6 h. The same scheme is used below.

