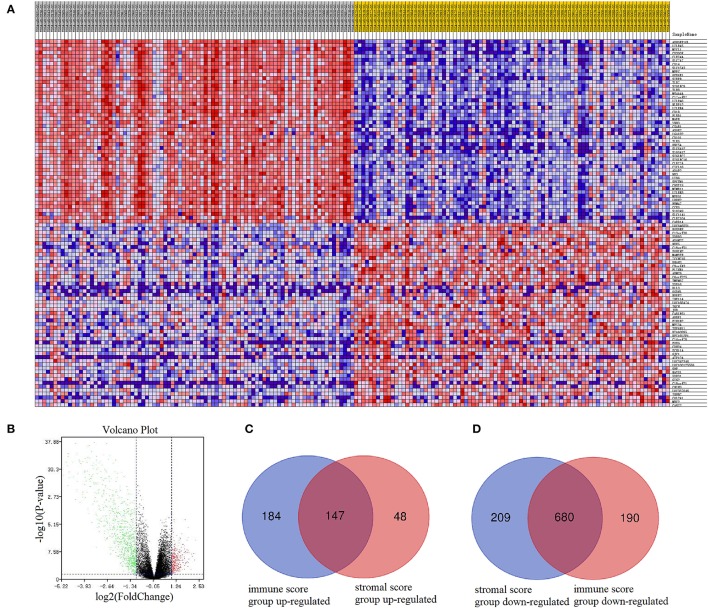
Figure 2.
Comparison of gene expression profiles with immune scores and stromal scores in AML. In immune score group, heatmap (A) and volcano plot (B) were used to demonstrated differential expressed genes. Venn plots were performed to reveal up-regulated intersect genes (C) and down-regulated intersect genes (D).

