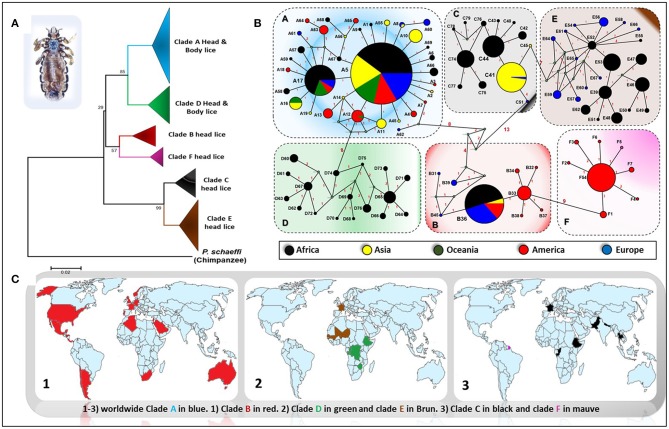
Figure 1.
Phylogeography of body and head lice haplogroups. (A) Neighbor-joining tree based on Cytb haplotypes. (B) Median Joining Network representing the existing relationships between different haplotypes. Pie colors and sizes in circles represent the continents and the number of their sequence for a haplotype. (C) Maps of the world showing the distribution of louse clades.

